Exam 12: Aggregate Demand and Aggregate Supply
Exam 1: First Principles183 Questions
Exam 2: Economic Models: Trade-Offs and Trade341 Questions
Exam 3: Supply and Demand230 Questions
Exam 4: Price Controls and Quotas: Meddling With Markets187 Questions
Exam 5: International Trade224 Questions
Exam 6: Macroeconomics: the Big Picture128 Questions
Exam 7: GDP and the CPI: Tracking the Macroeconomy213 Questions
Exam 8: Unemployment and Inflation300 Questions
Exam 9: Long-Run Economic Growth268 Questions
Exam 10: Savings, Investment Spending, and the Financial Syst355 Questions
Exam 11: Income and Expenditure114 Questions
Exam 12: Aggregate Demand and Aggregate Supply308 Questions
Exam 13: Fiscal Policy120 Questions
Exam 14: Money, Banking, and the Federal Reserve System135 Questions
Exam 15: Monetary Policy316 Questions
Exam 16: Inflation, Disinflation, and Deflation194 Questions
Exam 17: Macroeconomics: Events and Ideas283 Questions
Exam 18: International Macroeconomics411 Questions
Select questions type
Use the following to answer questions:
Figure: AD-AS Model I 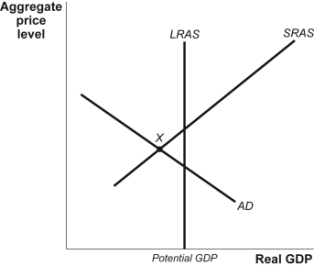 -(Figure: AD-AS Model I) Refer to Figure: AD-AS Model I. If the economy is at point X, the appropriate fiscal policy is to:
(Multiple Choice)
4.9/5  (43)
(43)
An increase in government spending on health care is likely to shift the _____ curve to the _____.
(Multiple Choice)
4.8/5 (41)
The aggregate demand curve shows that at higher price levels the quantity of aggregate output demanded will be less than at lower price levels.
(True/False)
4.8/5 (42)
Suppose that productivity increases as workers' health improves. This increase in productivity will:
(Multiple Choice)
4.9/5 (37)
In the late 1970s, the U.S. economy slid to the _____ along the aggregate _____ curve.
(Multiple Choice)
4.8/5 (41)
Unexpectedly rising commodity prices lead to a _____ shock.
(Multiple Choice)
4.7/5 (35)
Use the following to answer questions:
Figure: Inflationary and Recessionary Gaps 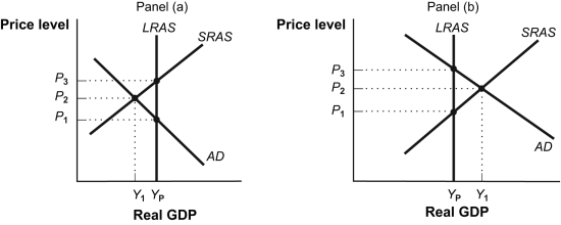 -(Figure: Inflationary and Recessionary Gaps) Refer to Figure: Inflationary and Recessionary Gaps. If the economy is in short-run equilibrium at Y1 in panel (a), the economy is in:
(Multiple Choice)
4.9/5 (43)
A graphical representation of the relationship between the total quantity of goods and services demanded and the price level is the:
(Multiple Choice)
4.8/5 (34)
Increasing the quantity of money in circulation shifts the _____ curve to the _____.
(Multiple Choice)
4.8/5 (42)
The economy is in short-run macroeconomic equilibrium when the quantity of aggregate output supplied is equal to the quantity of aggregate output demanded.
(True/False)
4.9/5 (38)
The interest rate effect is the tendency for changes in the price level to affect:
(Multiple Choice)
4.8/5 (39)
Reducing taxes in response to a recession is an example of _____ policy.
(Multiple Choice)
4.7/5 (36)
The long-run supply curve illustrates how the aggregate output supplied is _____ the aggregate price level.
(Multiple Choice)
4.8/5 (30)
Use the following to answer questions:
Figure: Inflationary and Recessionary Gaps
-(Figure: Inflationary and Recessionary Gaps) Refer to Figure: Inflationary and Recessionary Gaps. If the economy is in short-run equilibrium at Y1 in panel (b), to return to potential output at YP policy makers should use:
(Multiple Choice)
4.9/5 (41)
A positive short-run aggregate supply shock increases aggregate output and the aggregate price level.
(True/False)
4.8/5 (33)
When the economy is in a recessionary gap, the government can improve economic outcomes by:
(Multiple Choice)
4.7/5 (36)
A(n) _____ would likely shift the short-run aggregate supply curve to the left.
(Multiple Choice)
4.9/5 (38)
Because the aggregate price level has no effect on aggregate output in the long run, the long-run aggregate supply curve is:
(Multiple Choice)
4.8/5 (36)
Filters
- Essay(0)
- Multiple Choice(0)
- Short Answer(0)
- True False(0)
- Matching(0)