Exam 10: Externalities
Exam 1: Ten Principles of Economics387 Questions
Exam 2: Thinking Like an Economist569 Questions
Exam 3: Interdependence and the Gains From Trade463 Questions
Exam 4: The Market Forces of Supply and Demand606 Questions
Exam 5: Elasticity and Its Application524 Questions
Exam 6: Supply,demand,and Government Policies593 Questions
Exam 7: Consumers,producers,and the Efficiency of Markets496 Questions
Exam 8: Application: The Costs of Taxation453 Questions
Exam 9: Application: International Trade441 Questions
Exam 10: Externalities473 Questions
Exam 11: Public Goods and Common Resources388 Questions
Exam 12: The Design of the Tax System499 Questions
Exam 13: The Costs of Production507 Questions
Exam 14: Firms in Competitive Markets502 Questions
Exam 15: Monopoly541 Questions
Exam 16: Monopolistic Competition521 Questions
Exam 17: Oligopoly428 Questions
Exam 18: The Market for the Factors of Production477 Questions
Exam 19: Earnings and Discrimination425 Questions
Exam 20: Income Inequality and Poverty399 Questions
Exam 21: The Theory of Consumer Choice492 Questions
Exam 22: Frontiers of Microeconomics380 Questions
Exam 23: Measuring a Nations Income464 Questions
Exam 24: Measuring the Cost of Living452 Questions
Exam 25: Production and Growth457 Questions
Exam 26: Saving,investment,and the Financial System502 Questions
Exam 27: The Basic Tools of Finance461 Questions
Exam 28: Unemployment610 Questions
Exam 29: The Monetary System461 Questions
Exam 30: Money Growth and Inflation427 Questions
Exam 31: Open-Economy Macroeconomic Models488 Questions
Exam 32: A Macroeconomic Theory of the Open Economy404 Questions
Exam 33: Aggregate Demand and Aggregate Supply511 Questions
Exam 34: The Influence of Monetary and Fiscal Policy on Aggregate Demand451 Questions
Exam 35: The Short-Run Trade-Off Between Inflation and Unemployment415 Questions
Exam 36: Six Debates Over Macroeconomic Policy273 Questions
Select questions type
Scenario 10-2
The demand curve for restored historic buildings slopes downward and the supply curve for restored historic buildings slopes upward.The production of the 50th restored historic building entails the following:
• a private cost of $800,000;
• a private value of $650,000;
• a social value of $800,000.
-Refer to Scenario 10-2.Is there an external cost associated with the restoration of the 50th historic building,or is there an external benefit? What is the amount of that external cost or external benefit?
(Essay)
4.9/5  (33)
(33)
Figure 10-11 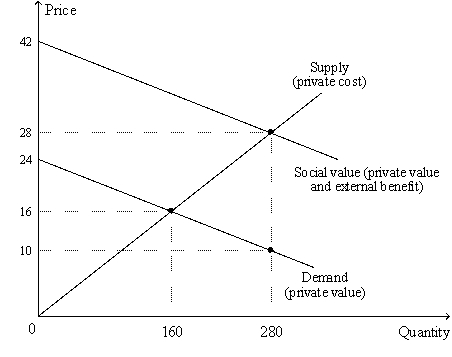 -Refer to Figure 10-11."The social value of the last unit produced exceeds the private cost of the last unit produced by $9." This statement is correct at which quantity of output?
(Multiple Choice)
4.8/5 (39)
Figure 10-5 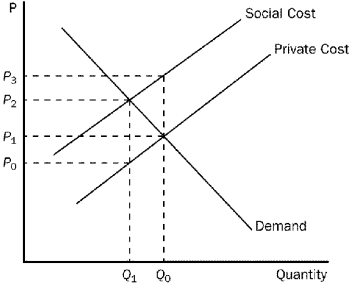 -Refer to Figure 10-5.Which price and quantity combination represents the social optimum?
(Multiple Choice)
4.9/5 (35)
Which of the following illustrates the concept of a negative externality?
(Multiple Choice)
4.8/5 (40)
Figure 10-12 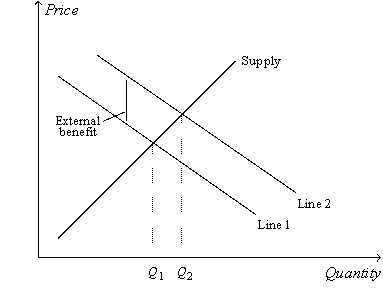 -Refer to Figure 10-12.Which of the following is an appropriate label for Line 1?
(Multiple Choice)
4.8/5 (39)
Which of the following is NOT a way of internalizing technology spillovers?
(Multiple Choice)
4.7/5 (40)
Although regulation and corrective taxes are both capable of reducing pollution,regulation accomplishes this goal more efficiently.
(True/False)
4.9/5 (33)
Figure 10-19 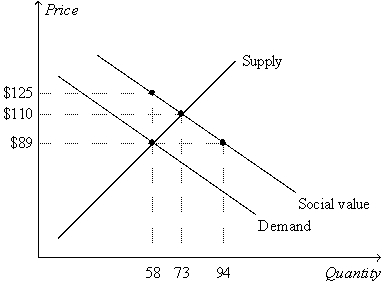 -Refer to Figure 10-19.The socially optimal quantity of output is
(Multiple Choice)
4.8/5 (36)
Figure 10-9 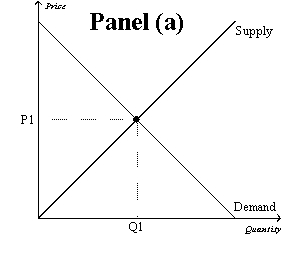
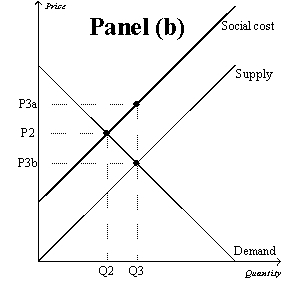
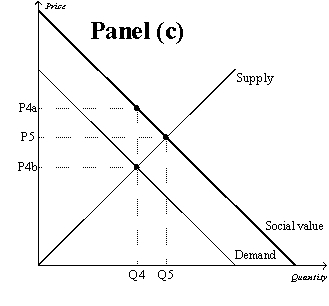 -Refer to Figure 10-9.Which graph represents a market with a negative externality?
(Multiple Choice)
4.8/5 (32)
Suppose that flu shots create a positive externality equal to $12 per shot.Further suppose that the government offers a $5 per-shot subsidy to producers.What is the relationship between the equilibrium quantity and the socially optimal quantity of flu shots produced?
(Multiple Choice)
4.9/5 (45)
If the production of computer chips yields greater technology spillovers than the production of potato chips,the government should
(Multiple Choice)
4.9/5 (39)
If the government wanted to ensure that the market reaches the socially optimal equilibrium in the presence of a technology spillover,it should
(Multiple Choice)
4.8/5 (36)
Which of the following is an advantage of tradable pollution permits?
(Multiple Choice)
4.8/5 (48)
Why are Pigovian taxes preferred to regulatory policies as methods to remedy negative externalities?
(Essay)
4.8/5 (43)
Markets are often inefficient when negative externalities are present because
(Multiple Choice)
4.9/5 (41)
Externalities can be corrected by each of the following except
(Multiple Choice)
4.8/5 (41)
Which of the following is not an effective method to reduce negative externalities?
(Multiple Choice)
4.8/5 (43)
Filters
- Essay(0)
- Multiple Choice(0)
- Short Answer(0)
- True False(0)
- Matching(0)