Exam 33: Aggregate Demand and Aggregate Supply
Exam 1: Ten Principles of Economics387 Questions
Exam 2: Thinking Like an Economist569 Questions
Exam 3: Interdependence and the Gains From Trade463 Questions
Exam 4: The Market Forces of Supply and Demand606 Questions
Exam 5: Elasticity and Its Application524 Questions
Exam 6: Supply,demand,and Government Policies593 Questions
Exam 7: Consumers,producers,and the Efficiency of Markets496 Questions
Exam 8: Application: The Costs of Taxation453 Questions
Exam 9: Application: International Trade441 Questions
Exam 10: Externalities473 Questions
Exam 11: Public Goods and Common Resources388 Questions
Exam 12: The Design of the Tax System499 Questions
Exam 13: The Costs of Production507 Questions
Exam 14: Firms in Competitive Markets502 Questions
Exam 15: Monopoly541 Questions
Exam 16: Monopolistic Competition521 Questions
Exam 17: Oligopoly428 Questions
Exam 18: The Market for the Factors of Production477 Questions
Exam 19: Earnings and Discrimination425 Questions
Exam 20: Income Inequality and Poverty399 Questions
Exam 21: The Theory of Consumer Choice492 Questions
Exam 22: Frontiers of Microeconomics380 Questions
Exam 23: Measuring a Nations Income464 Questions
Exam 24: Measuring the Cost of Living452 Questions
Exam 25: Production and Growth457 Questions
Exam 26: Saving,investment,and the Financial System502 Questions
Exam 27: The Basic Tools of Finance461 Questions
Exam 28: Unemployment610 Questions
Exam 29: The Monetary System461 Questions
Exam 30: Money Growth and Inflation427 Questions
Exam 31: Open-Economy Macroeconomic Models488 Questions
Exam 32: A Macroeconomic Theory of the Open Economy404 Questions
Exam 33: Aggregate Demand and Aggregate Supply511 Questions
Exam 34: The Influence of Monetary and Fiscal Policy on Aggregate Demand451 Questions
Exam 35: The Short-Run Trade-Off Between Inflation and Unemployment415 Questions
Exam 36: Six Debates Over Macroeconomic Policy273 Questions
Select questions type
Suppose the economy is in long-run equilibrium.If there is a tax cut at the same time that major new sources of oil are discovered in the country,then in the short-run
(Multiple Choice)
4.9/5  (43)
(43)
Part of the explanation for why the aggregate-demand curve slopes downward is that a decrease in the price level
(Multiple Choice)
4.9/5 (34)
If the actual price level is 165,but people had been expecting it to be 160,then
(Multiple Choice)
4.9/5 (48)
From 2001 to 2005 there was a dramatic rise in the price of houses.If this rise made people feel wealthier,then it would have shifted
(Multiple Choice)
4.9/5 (42)
Which of the following adjust to bring aggregate supply and demand into balance?
(Multiple Choice)
4.8/5 (27)
Figure 20-2. 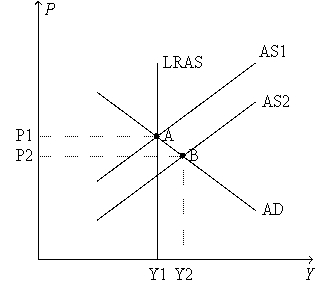 -Refer to Optimism.Which curve shifts and in which direction?
(Multiple Choice)
4.7/5 (26)
Changes in the price level affect which components of aggregate demand?
(Multiple Choice)
4.7/5 (29)
Other things the same,continued increases in technology lead to
(Multiple Choice)
4.8/5 (42)
Which of the following did not happen during the onset of the Great Depression?
(Multiple Choice)
4.8/5 (36)
The division of variables into real and nominal is a dichotomy assumed by
(Multiple Choice)
4.9/5 (31)
Figure 20-2.
-Refer to Stock Market Boom 2015.What happens to the expected price level and what impact does this have on wage bargaining?
(Multiple Choice)
4.8/5 (39)
Use sticky-wage theory to explain why an increase in the expected price level shifts the aggregate supply curve.
(Essay)
4.7/5 (35)
Keynes explained that recessions and depressions occur because of
(Multiple Choice)
4.8/5 (33)
Figure 33-1. 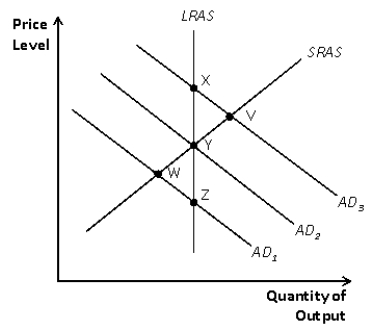 -Refer to Figure 33-1.Suppose the economy starts at Y.If aggregate demand increases from AD2 to AD3,then the economy moves to
(Multiple Choice)
4.8/5 (31)
Other things the same,the aggregate quantity of output supplied will increase if the price level
(Multiple Choice)
4.9/5 (29)
If the dollar appreciates,perhaps because of speculation or government policy,then U.S.net exports
(Multiple Choice)
4.8/5 (39)
Figure 20-2.
-Refer to Stock Market Boom 2015.How is the new long-run equilibrium different from the original one?
(Multiple Choice)
4.9/5 (48)
During the 2008-2009 unemployment rose from about 4.4% to about
(Multiple Choice)
4.9/5 (42)
Filters
- Essay(0)
- Multiple Choice(0)
- Short Answer(0)
- True False(0)
- Matching(0)