Exam 34: The Influence of Monetary and Fiscal Policy on Aggregate Demand
Exam 1: Ten Principles of Economics387 Questions
Exam 2: Thinking Like an Economist569 Questions
Exam 3: Interdependence and the Gains From Trade463 Questions
Exam 4: The Market Forces of Supply and Demand606 Questions
Exam 5: Elasticity and Its Application524 Questions
Exam 6: Supply,demand,and Government Policies593 Questions
Exam 7: Consumers,producers,and the Efficiency of Markets496 Questions
Exam 8: Application: The Costs of Taxation453 Questions
Exam 9: Application: International Trade441 Questions
Exam 10: Externalities473 Questions
Exam 11: Public Goods and Common Resources388 Questions
Exam 12: The Design of the Tax System499 Questions
Exam 13: The Costs of Production507 Questions
Exam 14: Firms in Competitive Markets502 Questions
Exam 15: Monopoly541 Questions
Exam 16: Monopolistic Competition521 Questions
Exam 17: Oligopoly428 Questions
Exam 18: The Market for the Factors of Production477 Questions
Exam 19: Earnings and Discrimination425 Questions
Exam 20: Income Inequality and Poverty399 Questions
Exam 21: The Theory of Consumer Choice492 Questions
Exam 22: Frontiers of Microeconomics380 Questions
Exam 23: Measuring a Nations Income464 Questions
Exam 24: Measuring the Cost of Living452 Questions
Exam 25: Production and Growth457 Questions
Exam 26: Saving,investment,and the Financial System502 Questions
Exam 27: The Basic Tools of Finance461 Questions
Exam 28: Unemployment610 Questions
Exam 29: The Monetary System461 Questions
Exam 30: Money Growth and Inflation427 Questions
Exam 31: Open-Economy Macroeconomic Models488 Questions
Exam 32: A Macroeconomic Theory of the Open Economy404 Questions
Exam 33: Aggregate Demand and Aggregate Supply511 Questions
Exam 34: The Influence of Monetary and Fiscal Policy on Aggregate Demand451 Questions
Exam 35: The Short-Run Trade-Off Between Inflation and Unemployment415 Questions
Exam 36: Six Debates Over Macroeconomic Policy273 Questions
Select questions type
If the spending multiplier is 8,then the marginal propensity to consume must be 7/8.
(True/False)
4.8/5  (38)
(38)
Figure 21-4.On the figure,MS represents money supply and MD represents money demand. 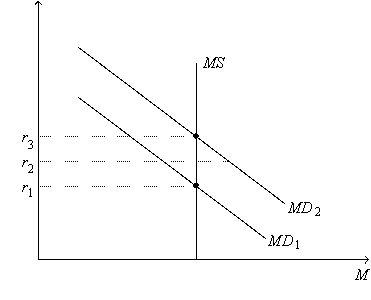 -Refer to Figure 21-4.Suppose the money-demand curve is currently MD1.If the current interest rate is r2,then
(Multiple Choice)
4.8/5 (35)
Assume the MPC is 0.75.Assume there is a multiplier effect and that the total crowding-out effect is $6 billion.An increase in government purchases of $10 billion will shift aggregate demand to the
(Multiple Choice)
4.8/5 (36)
Monetary policy affects the economy with a long lag,in part because
(Multiple Choice)
4.8/5 (37)
Figure 21-4.On the figure,MS represents money supply and MD represents money demand.
-Refer to Figure 21-4.Suppose the current equilibrium interest rate is r1.Let Y1 represent the corresponding quantity of goods and services demanded,and let P1 represent the corresponding price level.Starting from this situation,if the Federal Reserve increases the money supply and if the price level remains at P1,then
(Multiple Choice)
4.9/5 (37)
Figure 21-6.On the left-hand graph,MS represents the supply of money and MD represents the demand for money;on the right-hand graph,AD represents aggregate demand.The usual quantities are measured along the axes of both graphs.
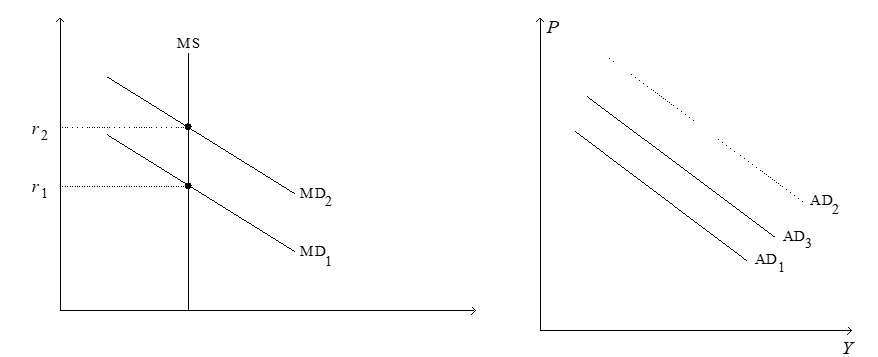 -Refer to Figure 21-6.Suppose the graphs are drawn to show the effects of an increase in government purchases.If it were not for the increase in r from r1 to r2,then
(Multiple Choice)
4.7/5 (42)
Suppose that the government increases expenditures by $150 billion while increasing taxes by $150 billion.Suppose that the MPC is .80 and that there are no crowding out or accelerator effects.What is the combined effects of these changes? Why is the combined change not equal to zero?
(Essay)
4.8/5 (33)
Filters
- Essay(0)
- Multiple Choice(0)
- Short Answer(0)
- True False(0)
- Matching(0)