Exam 4: Equilibrium: How Supply and Demand Determine Prices
Exam 1: The Big Ideas253 Questions
Exam 2: The Power of Trade and Comparative Advantage262 Questions
Exam 3: Supply and Demand255 Questions
Exam 4: Equilibrium: How Supply and Demand Determine Prices265 Questions
Exam 5: Price Ceilings and Floors325 Questions
Exam 6: GDP and the Measurement of Progress329 Questions
Exam 7: The Wealth of Nations and Economic Growth280 Questions
Exam 8: Growth, Capital Accumulation and the Economics of Ideas: Catching up Vs the Cutting Edge295 Questions
Exam 9: Saving, Investment, and the Financial System312 Questions
Exam 10: Stock Markets and Personal Finance275 Questions
Exam 11: Unemployment and Labor Force Participation259 Questions
Exam 12: Inflation and the Quantity Theory of Money289 Questions
Exam 13: Business Fluctuations: Aggregate Demand and Supply337 Questions
Exam 14: Transmission and Amplification Mechanisms221 Questions
Exam 15: The Federal Reserve System and Open Market Operations313 Questions
Exam 16: Monetary Policy266 Questions
Exam 17: The Federal Budget: Taxes and Spending281 Questions
Exam 18: Fiscal Policy273 Questions
Exam 19: International Trade195 Questions
Exam 20: International Finance307 Questions
Exam 21: Political Economy and Public Choice306 Questions
Select questions type
Imagine a free market in equilibrium. After a sudden decrease in demand (but before the price can adjust), the market experiences a:
(Multiple Choice)
4.9/5  (35)
(35)
Use the following to answer questions: Figure: Price and Quantity 3 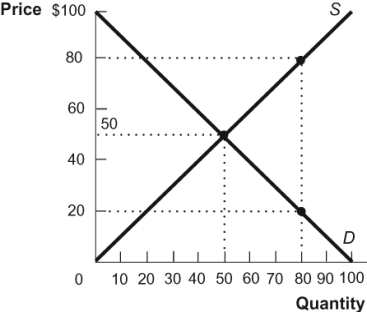 -(Figure: Price and Quantity 3) The value of wasted resources at a quantity of 80 units in the diagram is:
(Multiple Choice)
4.8/5 (31)
Use the following to answer questions: Figure: Price and Quantity 1 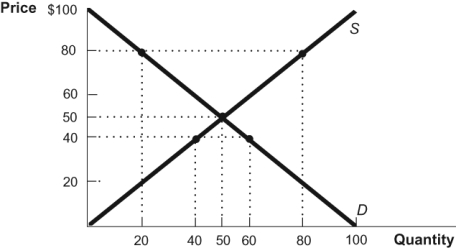 -(Figure: Price and Quantity 1) In the diagram, at a price of $80, the quantity demanded is ______, the quantity supplied is ______, and there is ______.
(Multiple Choice)
4.9/5 (45)
Use the following to answer questions: Figure: Market Equilibrium 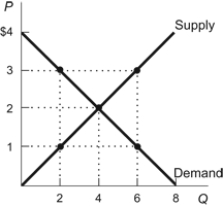 -(Figure: Market Equilibrium) Refer to the figure. At a price of $1, the market is characterized by a(n):
(Multiple Choice)
4.8/5 (32)
Figure: Supply and Demand 1 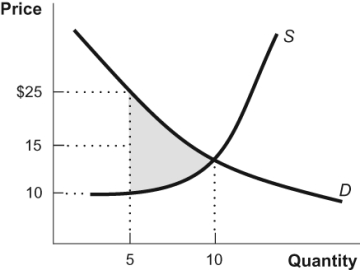 At a market quantity of 5, the shaded region in the figure represents:
(Multiple Choice)
4.8/5 (40)
Figure: Price and Quantity 4 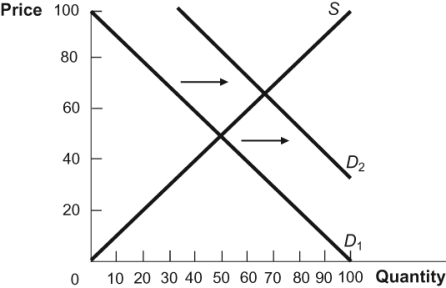 If the figure depicts a market for an inferior good, which of the following statements describes what could have happened?
(Multiple Choice)
4.8/5 (45)
Use the following to answer questions: Table: Equilibrium Adjustment Price Quantity Demanded Quantity Supplied \ 10 100 160 8 120 145 6 130 130 4 140 115 2 150 100
-(Table: Equilibrium Adjustment) Refer to the table. If the price in the free market is $8, then a:
(Multiple Choice)
4.8/5 (36)
The government must subsidize firms to ensure that there are no unexploited gains from trade.
(True/False)
4.7/5 (37)
The growing economies of China and India have increased the demand for:
(Multiple Choice)
4.7/5 (35)
Use the following to answer questions: Figure: Demand, Supply Shifts  -(Figure: Demand, Supply Shifts) In the figure, the initial demand curve is D1 and the initial supply curve is S1. If this depicts the equilibrium in the market for computer printers, what will happen when the price of computers increases?
(Multiple Choice)
4.8/5 (35)
An increase in supply raises the equilibrium price and increases the equilibrium quantity.
(True/False)
4.9/5 (43)
A free market achieves an equilibrium price and quantity due to:
(Multiple Choice)
4.8/5 (38)
Use the following to answer questions: Figure: Price and Quantity 2 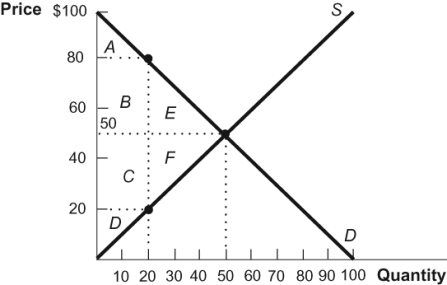 -(Figure: Price and Quantity 2) At a cost of $20 per unit in the diagram, the value of the unexploited gains from trade is:
(Multiple Choice)
4.9/5 (36)
Which of the following events will cause a decrease in the equilibrium price?
(Multiple Choice)
4.8/5 (29)
Which of the following might explain why the price of DVD players has been falling?
(Multiple Choice)
4.8/5 (37)
Use the following to answer questions: Figure: Price and Quantity 1
-(Figure: Price and Quantity 1) In the diagram, at which price is there a surplus?
(Multiple Choice)
4.7/5 (30)
When the quantity supplied of a good exceeds the quantity demanded, there is a(n):
(Multiple Choice)
4.8/5 (46)
At a free market equilibrium there are no unexploited gains from trade.
(True/False)
4.9/5 (40)
A market shortage can be defined as a situation in which the quantity supplied in a market is greater than the quantity demanded, at the given price.
(True/False)
4.8/5 (35)
There is a positive relationship between price and quantity supplied.
(True/False)
4.8/5 (44)
Filters
- Essay(0)
- Multiple Choice(0)
- Short Answer(0)
- True False(0)
- Matching(0)