Exam 8: Short-Run Costs and Output Decisions
Exam 1: The Scope and Method of Economics68 Questions
Exam 2: The Economic Problem: Scarcity and Choice50 Questions
Exam 3: Demand, Supply, and Market Equilibrium52 Questions
Exam 4: Demand and Supply Applications41 Questions
Exam 5: Elasticity74 Questions
Exam 6: Household Behavior and Consumer Choice50 Questions
Exam 7: The Production Process: the Behavior of Profit-Maximizing Firms64 Questions
Exam 8: Short-Run Costs and Output Decisions59 Questions
Exam 9: Long-Run Costs and Output Decisions87 Questions
Exam 10: Input Demand: the Labor and Land Markets77 Questions
Exam 11: Input Demand: the Capital Market and the Investment Decision66 Questions
Exam 12: General Equilibrium and the Efficiency of Perfect Competition44 Questions
Exam 13: Monopoly and Antitrust Policy45 Questions
Exam 14: Oligopoly53 Questions
Exam 15: Monopolistic Competition31 Questions
Exam 16: Externalities, Public Goods, and Social Choice54 Questions
Select questions type
Comment on the following statement: "In the short run, a firm's total costs will be zero if the firm chooses to produce nothing."
(Essay)
4.7/5  (36)
(36)
The president of a company is told that the fixed costs next year will be higher than anticipated. Even so he has told his operations managers that this should not affect their production levels. Comment on this statement.
(Essay)
4.9/5 (31)
When Peter's Pizza Company produces 50 pizzas, its average total cost is $8. The marginal cost of the 51st pizza is $7. If the firm chooses to produce the 51st pizza, what will happen to average total cost? Explain.
(Essay)
4.7/5 (30)
Use the graph below to calculate the marginal cost of the first, second and third unit of output. 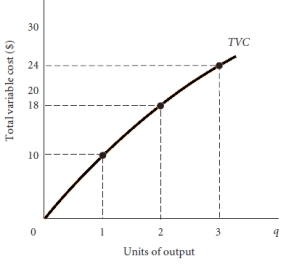
(Essay)
4.8/5 (41)
Suppose that a firm has an average variable cost of $52.50 when producing 120 units of output. What is the firm's total variable cost?
(Essay)
4.9/5 (30)
Prove that marginal cost is actually the slope of the total variable cost curve. 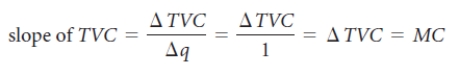
(Essay)
4.8/5 (37)
Stu's Shoe Company faces the following cost schedule:
 Fill in the blanks.
(Essay)
4.9/5 (40)
Comment on the following statement: "Average fixed cost falls as output rises, but average fixed cost will never be equal to zero."
(Essay)
4.8/5 (39)
Assume that fixed costs for a firm are $1,000. Draw a graph for the fixed cost of this firm accompanied by a graph of the average fixed cost. Explain the shape of the average fixed cost graph. 
(Essay)
4.8/5 (34)
Under which circumstances could the marginal cost and average variable cost curves be one and the same?
(Essay)
4.8/5 (26)
Explain why the average total cost curve and the average variable cost curve get closer to each other as output expands.
(Essay)
4.8/5 (31)
If total costs are $18,000 for the year, and the firm has fixed costs of $12,000, what is the level of the firm's variable costs?
(Essay)
4.9/5 (38)
What is meant by fixed cost? What kinds of things might be included in fixed cost?
(Essay)
4.7/5 (36)
Draw two graphs: one showing how total variable cost varies with output and the other showing how average variable cost varies with output.
(Essay)
4.8/5 (44)
The market for light bulbs is perfectly competitive and can be represented by the following market demand and supply curves: 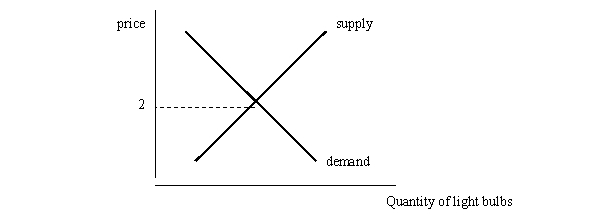 Draw the demand curve as seen by one firm in the light bulb industry. Explain the shape of this curve.
(Essay)
4.9/5 (31)
It is common to see convenience stores open 24 hours a day even though many times late at night or in the early hours of the morning there are very few customers. What can explain this seemingly odd behavior?
(Essay)
4.9/5 (33)
Filters
- Essay(0)
- Multiple Choice(0)
- Short Answer(0)
- True False(0)
- Matching(0)