Exam 4: Trade: Factor Availability and Factor Proportions Are Key
Exam 1: International Economics Is Different60 Questions
Exam 2: The Basic Theory Using Demand and Supply60 Questions
Exam 3: Why Everybody Trades: Comparative Advantage59 Questions
Exam 4: Trade: Factor Availability and Factor Proportions Are Key48 Questions
Exam 5: Who Gains and Who Loses From Trade60 Questions
Exam 6: Scale Economies, Imperfect Competition, and Trade59 Questions
Exam 7: Growth and Trade Part II: Trade Policy60 Questions
Exam 8: Analysis of a Tariff60 Questions
Exam 9: Nontariff Barriers to Imports60 Questions
Exam 10: Arguments for and Against Protection60 Questions
Exam 11: Pushing Exports52 Questions
Exam 12: Trade Blocs and Trade Blocks60 Questions
Exam 13: Trade and the Environment60 Questions
Exam 14: Trade Policies for Developing Countries60 Questions
Exam 15: Multinationals and Migration: International Factor Movements60 Questions
Exam 16: Payments Among Nations60 Questions
Exam 17: The Foreign Exchange Market56 Questions
Exam 18: Forward Exchange and International Financial Investment60 Questions
Exam 19: What Determines Exchange Rates44 Questions
Exam 20: Government Policies Toward the Foreign Exchange Market56 Questions
Exam 21: International Lending and Financial Crises60 Questions
Exam 22: How Does the Open Macroeconomy Work59 Questions
Exam 23: Internal and External Balance With Fixed Exchange Rates59 Questions
Exam 24: Floating Exchange Rates and Internal Balance60 Questions
Exam 25: National and Global Choices: Floating Rates and the Alternatives60 Questions
Select questions type
Increasing-cost production-possibility curves are bowed out from the origin.
(True/False)
4.7/5  (41)
(41)
In the figure given below AB is the production-possibility curve of Canada. In the absence of trade, the price ratio is 1 bushel of wheat/bale of cotton as shown by the line PQ. The international price ratio is 0.25 bushels of wheat/bale of cotton as shown by the line RS. I1 and I2 are the pre-trade and the post trade community indifference curves of Canada respectively. In the absence of trade Canada will: 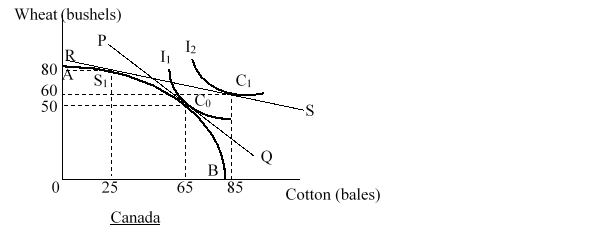
(Multiple Choice)
4.8/5 (44)
The figure given below shows the production-possibility curves of Canada (AB) and the Rest of the World (CD). The pre-trade price ratio in Canada and the Rest of the World are given by the lines P1 and P3 respectively. The international price ratio faced by the countries is represented by the line P2. I?1 and I2 are the pre-trade and post-trade social indifference curves for both Canada and the Rest of the World respectively. Before Canada entered into a trade with the rest of the world, the total amount of cotton produced in the world was _____ bales and the total amount of wheat produced in the world was _____ bushels. 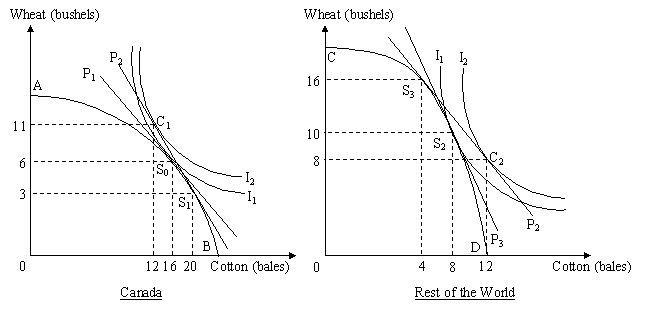
(Multiple Choice)
4.9/5 (42)
In international trade jargon, constant cost production-possibility curves are associated with _____ specialization while increasing cost production-possibility curves are associated with _____ specialization.
(Multiple Choice)
4.8/5 (35)
Which of the following statements is true about production-possibility curves?
(Multiple Choice)
4.8/5 (33)
China has 20% of the world's population but only 10% of the world's farmable land. Which of the following will be predicted by the Heckscher-Ohlin theory, if China begins to trade with other countries?
(Multiple Choice)
4.8/5 (25)
Assume that country X produces two goods-sugar and shoes-and that the country's production possibility curve is "bowed-out." As the country produces more sugar the opportunity cost of sugar in terms of shoes foregone will:
(Multiple Choice)
4.8/5 (32)
The figure given below shows the post-trade production and consumption points in country Y. AB is the production-possibility curve of country Y. I1 is the community indifference curve of country Y. Here country Y's production-possibility curve indicates that it faces _____ marginal costs of production. 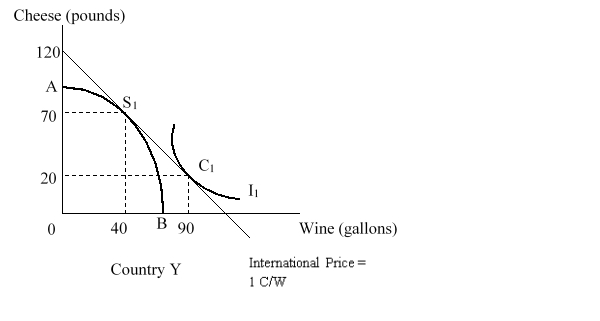
(Multiple Choice)
4.8/5 (30)
Filters
- Essay(0)
- Multiple Choice(0)
- Short Answer(0)
- True False(0)
- Matching(0)