Exam 11: Standard Multiple Regression
Exam 1: An Introduction to the Research Process9 Questions
Exam 2: Descriptive Statistics10 Questions
Exam 3: The Basis of Statistical Testing12 Questions
Exam 4: Epidemiology10 Questions
Exam 5: Introduction to Data Screening and Cleaning10 Questions
Exam 6: Differences Between Two Groups7 Questions
Exam 7: Differences Between Three or More Conditions10 Questions
Exam 8: Testing Associations Between Categorical Variables10 Questions
Exam 9: Measuring Agreement: Correlational Techniques8 Questions
Exam 10: Linear Regression10 Questions
Exam 11: Standard Multiple Regression10 Questions
Exam 12: Logistic Regression10 Questions
Exam 13: Interventions and Analysis of Change10 Questions
Exam 14: Survival Analysis: an Introduction10 Questions
Select questions type
Which of those below allows us to determine the slope of the regression lines for individual predictors?
Free
(Multiple Choice)
5.0/5  (37)
(37)
Correct Answer: Verified
B
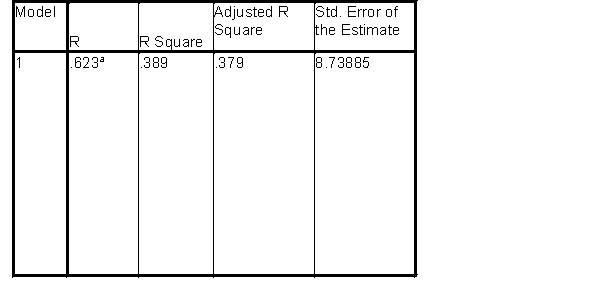
Questions relate to the following output which is from a Standard Multiple Regression where the researchers wished to assess the contribution of stress and stigma to depression.
Model Summary
a.Predictors: Constant), total of perceived stress, total of Stigma for neurological conditions
 ANOVAb
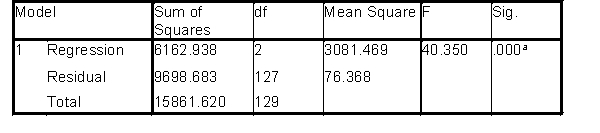 a.Predictors: Constant), total of perceived stress, total of Stigma for neurological conditions
b.Dependent Variable: total of CES-D depression
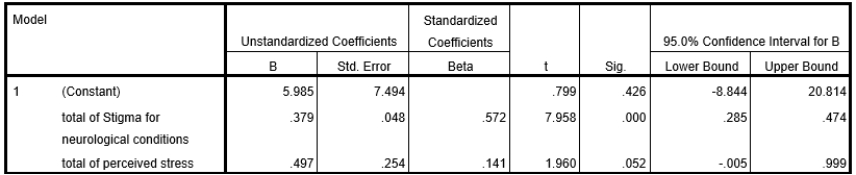
Coefficientsa
a.Predictors: Constant), total of perceived stress, total of Stigma for neurological conditions
b.Dependent Variable: total of CES-D depression
Coefficientsa
 a.Dependent Variable: total of CES-D depression
-The regression equation is:
a.Dependent Variable: total of CES-D depression
-The regression equation is:
Free
(Multiple Choice)
5.0/5 (42)
Correct Answer:Verified
A,B,C
Questions relate to the following output which is from a Standard Multiple Regression where the researchers wished to assess the contribution of stress and stigma to depression.
Model Summary
a.Predictors: Constant), total of perceived stress, total of Stigma for neurological conditions
ANOVAb
a.Predictors: Constant), total of perceived stress, total of Stigma for neurological conditions
b.Dependent Variable: total of CES-D depression
Coefficientsa
a.Dependent Variable: total of CES-D depression
-Which of the following is the most appropriate answer?
Free
(Multiple Choice)
4.8/5 (40)
Correct Answer:Verified
A
In a multiple regression analysis which of the following allows us to compare the predictor variables on a like-for-like basis?
(Multiple Choice)
4.9/5 (32)
Tabachnick and Fidell 2009) have a formula in order to calculate how many participants are needed to ensure a reliable multiple regression analysis.What is the formula?
(Multiple Choice)
4.9/5 (38)
Questions relate to the following output which is from a Standard Multiple Regression where the researchers wished to assess the contribution of stress and stigma to depression.
Model Summary
a.Predictors: Constant), total of perceived stress, total of Stigma for neurological conditions
ANOVAb
a.Predictors: Constant), total of perceived stress, total of Stigma for neurological conditions
b.Dependent Variable: total of CES-D depression
Coefficientsa
a.Dependent Variable: total of CES-D depression
-Stress and stigma together predicted depression
(Multiple Choice)
4.8/5 (27)
Questions relate to the following output which is from a Standard Multiple Regression where the researchers wished to assess the contribution of stress and stigma to depression.
Model Summary
a.Predictors: Constant), total of perceived stress, total of Stigma for neurological conditions
ANOVAb
a.Predictors: Constant), total of perceived stress, total of Stigma for neurological conditions
b.Dependent Variable: total of CES-D depression
Coefficientsa
a.Dependent Variable: total of CES-D depression
-Which is the most appropriate answer? For every one
(Multiple Choice)
4.9/5 (39)
When you look at the individual results in a standard multiple regression, the results represent
(Multiple Choice)
4.9/5 (35)
Assume you have carried out a Standard Multiple Regression in which the Multiple R is found to be high, but none of the predictor variables are, individually, statistically significant.The most likely reason for this is:
(Multiple Choice)
4.9/5 (32)
If, for a multiple regression, you have many variables and not enough participants in the analysis, then the statistics will be:
(Multiple Choice)
4.9/5 (33)
Filters
- Essay(0)
- Multiple Choice(0)
- Short Answer(0)
- True False(0)
- Matching(0)