Exam 2: Psychosocial Health
Exam 1: Healthy Change79 Questions
Exam 2: Psychosocial Health75 Questions
Exam 3: Stress86 Questions
Exam 4: Relationships and Sexuality69 Questions
Exam 5: Reproductive Choices87 Questions
Exam 6: Addiction and Drug Abuse109 Questions
Exam 7: Alcohol and Tobacco114 Questions
Exam 8: Nutrition103 Questions
Exam 9: Weight Management and Body Image141 Questions
Exam 10: Fitness40 Questions
Exam 11: Cvd, Cancer, and Diabetes83 Questions
Exam 12: Infectious Conditions32 Questions
Exam 13: Violence and Unintentional Injuries33 Questions
Exam 14: Environmental Health64 Questions
Exam 15: Consumerism and Complementary and Alternative Medicine150 Questions
Exam 16: Forecasting Techniques and Analysis for Time Series Data214 Questions
Select questions type
Discrete data can have an infinite number of values within a specific interval.
Free
(True/False)
4.8/5  (36)
(36)
Correct Answer: Verified
False
---------group several values in a single column within the same category in a vertical direction.
Free
(Multiple Choice)
4.8/5 (37)
Correct Answer:Verified
D
The sum of the relative frequencies for the relative frequency distribution should be equal to or very close to 1.0 due to rounding.
Free
(True/False)
4.8/5 (34)
Correct Answer:Verified
True
The estimated class width for a frequency distribution using grouped quantitative data should be rounded to an integer value to make the class boundaries more readable.
(True/False)
4.8/5 (30)
Pareto charts display the categories in an increasing order with the least problematic categories shown first.
(True/False)
4.8/5 (35)
When you want to compare the shape of two or more distributions on one graph, a ------------ is your best choice
(Multiple Choice)
4.8/5 (36)
Equal- size classes refer to classes for a frequency distribution using grouped quantitative data that do not overlap.
(True/False)
4.8/5 (40)
The following graph shows the curb weight of seven cars, in pounds, along with their corresponding highway miles per gallon.
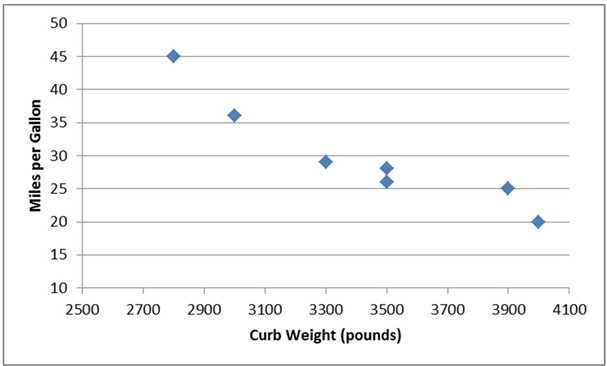
(Multiple Choice)
4.8/5 (41)
Clustered bar charts are preferred over stacked bar charts when you are displaying totals in each category, such as what team scored the most points over the two- year period.
(True/False)
4.8/5 (44)
------provide a format to display observations that have more than one value associated with them.
(Multiple Choice)
4.8/5 (32)
The class---------- is the breadth, or range, of numbers we plan to put into each class of a frequency distribution using grouped quantitative data.
(Multiple Choice)
4.8/5 (41)
Pareto charts also plot the cumulative relative frequency as a line on the chart. This line is known as a(n)----------.
(Multiple Choice)
4.8/5 (32)
The sum of the cumulative relative frequencies for the cumulative relative frequency distribution should be equal to or very close to 1.0 due to rounding.
(True/False)
4.8/5 (30)
--------display the proportion of observations of each class relative to the total number of observations.
(Multiple Choice)
4.9/5 (39)
The independent variable on scatter plots is placed on the vertical axis on the graph.
(True/False)
4.8/5 (36)
Income and age are examples of data that are technically discrete but are normally displayed in a continuous format.
(True/False)
4.9/5 (40)
A symmetrical distribution is one in which the right side of the distribution looks like the mirror image of the left side of the distribution.
(True/False)
4.8/5 (37)
Filters
- Essay(0)
- Multiple Choice(0)
- Short Answer(0)
- True False(0)
- Matching(0)