Exam 3: Polynomial and Rational Functions
Exam 1: Equations and Inequalities419 Questions
Exam 2: Functions and Graphs144 Questions
Exam 3: Polynomial and Rational Functions224 Questions
Exam 4: Exponential and Logarithmic Functions146 Questions
Exam 5: Systems of Equations and Inequalities160 Questions
Select questions type
Determine whether the given quadratic function has a minimum value or maximum value. Then find the coordinates of
the minimum or maximum point.
-
(Multiple Choice)
5.0/5  (43)
(43)
Use the vertex and intercepts to sketch the graph of the quadratic function.
-
(Multiple Choice)
4.9/5 (36)
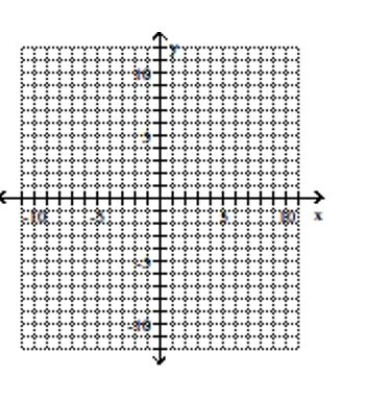
Determine whether the graph shown is the graph of a polynomial function.
-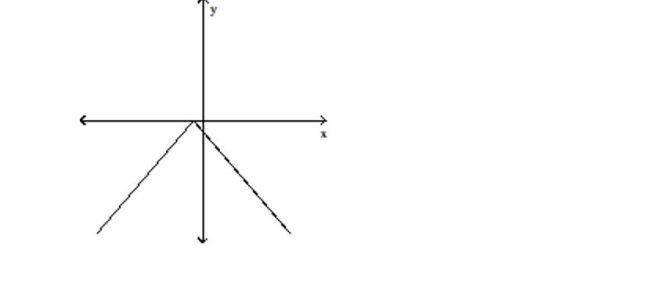
(Multiple Choice)
5.0/5 (31)
Find the x-intercepts (if any) for the graph of the quadratic function.
-
(Multiple Choice)
4.7/5 (30)
Use the Leading Coefficient Test to determine the end behavior of the polynomial function. Then use this end behavior
to match the function with its graph.
-
(Multiple Choice)
4.9/5 (34)
Find the x-intercepts of the polynomial function. State whether the graph crosses the x-axis, or touches the x-axis and
turns around, at each intercept.
-
(Multiple Choice)
4.8/5 (41)
Determine whether the graph of the polynomial has y-axis symmetry, origin symmetry, or neither.
-
(Multiple Choice)
4.8/5 (37)
Find the x-intercepts of the polynomial function. State whether the graph crosses the x-axis, or touches the x-axis and
turns around, at each intercept.
-
(Multiple Choice)
4.8/5 (44)
Find the x-intercepts of the polynomial function. State whether the graph crosses the x-axis, or touches the x-axis and
turns around, at each intercept.
-
(Multiple Choice)
4.9/5 (34)
Determine the maximum possible number of turning points for the graph of the function.
-
(Multiple Choice)
4.7/5 (29)
Find the axis of symmetry of the parabola defined by the given quadratic function.
-
(Multiple Choice)
4.9/5 (34)
Find the axis of symmetry of the parabola defined by the given quadratic function.
-
(Multiple Choice)
4.8/5 (38)
Determine whether the graph of the polynomial has y-axis symmetry, origin symmetry, or neither.
-
(Multiple Choice)
5.0/5 (32)
Solve the problem
-A herd of moose is introduced to a wildlife refuge. The number of moose, , after years is described by the polynomial function . Use the Leading Coefficient Test to determine the graph's end behavior. What does this mean about what will eventually happen to the moose population?
(Multiple Choice)
4.9/5 (39)
Determine whether the graph of the polynomial has y-axis symmetry, origin symmetry, or neither.
-
(Multiple Choice)
4.9/5 (37)
Solve the problem
-The following table shows the number of speeding tickets issued in a county for the years 1994-1998, where 1 represents 1995, and so on.
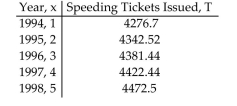 This data can be approximated using the third-degree polynomial
Use the Leading Coefficient Test to determine the end behavior to the right for the graph of T. Will this function be useful in modeling the number of speeding tickets issued over an extended period of time? Explain your answer.
This data can be approximated using the third-degree polynomial
Use the Leading Coefficient Test to determine the end behavior to the right for the graph of T. Will this function be useful in modeling the number of speeding tickets issued over an extended period of time? Explain your answer.
(Multiple Choice)
4.7/5 (43)
Determine whether the given quadratic function has a minimum value or maximum value. Then find the coordinates of
the minimum or maximum point.
-
(Multiple Choice)
5.0/5 (40)
Find the coordinates of the vertex for the parabola defined by the given quadratic function.
-
(Multiple Choice)
4.9/5 (38)
Filters
- Essay(0)
- Multiple Choice(0)
- Short Answer(0)
- True False(0)
- Matching(0)