Exam 3: Graphing and Functions
Exam 1: Real Numbers and Variables207 Questions
Exam 2: Equations, Inequalities, and Applications194 Questions
Exam 3: Graphing and Functions85 Questions
Exam 4: Systems of Linear Equations and Inequalities108 Questions
Exam 5: Exponents and Polynomials132 Questions
Exam 6: Factoring126 Questions
Exam 7: Rational Expressions and Equations86 Questions
Exam 8: Rational Exponents and Radicals62 Questions
Exam 9: Quadratic Equations and Inequalities124 Questions
Exam 10: The Conic Sections64 Questions
Exam 11: Additional Properties of Functions77 Questions
Exam 12: Logarithmic and Exponential Functions79 Questions
Select questions type
The map below has horizontal and vertical grid markers for ease of use. For example, Newport is located in grid A4. Use
the grid labels to indicate the location of the given city.
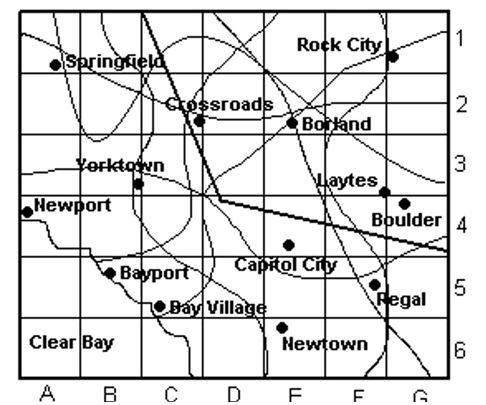 -Springfield
(Multiple Choice)
4.8/5  (31)
(31)
The map below has horizontal and vertical grid markers for ease of use. For example, Newport is located in grid A4. Use
the grid labels to indicate the location of the given city.
-Borland
(Multiple Choice)
4.9/5 (33)
Find the missing coordinate to complete the ordered pair.
-
(Multiple Choice)
4.8/5 (38)
Consider the points plotted in the graph below.
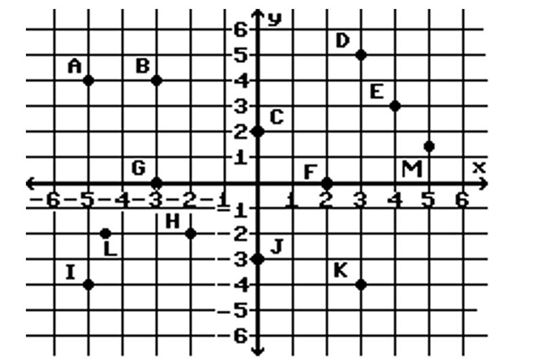 -Give the coordinates for points I and J.
(Multiple Choice)
4.8/5 (36)
Solve.
-The population of an endangered species living in a controlled habitat is given by the equation P = 7t + 49, where P is the population and t is the time in months since the population was moved to the habitat. Graph the
Equation for t = 0, 6, 12, and 18. 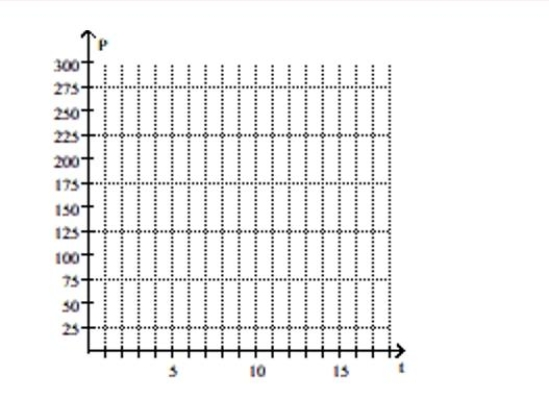
(Multiple Choice)
4.8/5 (40)
The map below has horizontal and vertical grid markers for ease of use. For example, Newport is located in grid A4. Use
the grid labels to indicate the location of the given city.
-Capitol City
(Multiple Choice)
4.7/5 (33)
Consider the points plotted in the graph below.
-Give the coordinates for point K.
(Multiple Choice)
4.9/5 (42)
The map below has horizontal and vertical grid markers for ease of use. For example, Newport is located in grid A4. Use
the grid labels to indicate the location of the given city.
-Newtown
(Multiple Choice)
4.8/5 (31)
Write the equation of the line in slope-intercept form.
- -intercept
(Multiple Choice)
4.8/5 (39)
Filters
- Essay(0)
- Multiple Choice(0)
- Short Answer(0)
- True False(0)
- Matching(0)