Exam 10: An Introduction to Calculus: Limits, Derivatives, and Integrals
Exam 1: Functions and Graphs50 Questions
Exam 2: Polynomial, Power, and Rational Functions52 Questions
Exam 3: Exponential, Logistic, and Logarithmic Functions52 Questions
Exam 4: Trigonometric Functions50 Questions
Exam 5: Analytic Trigonometry50 Questions
Exam 6: Applications of Trigonometry52 Questions
Exam 7: Systems and Matrices50 Questions
Exam 8: Analytic Geometry in Two and Three Dimensions52 Questions
Exam 9: Discrete Mathematics62 Questions
Exam 10: An Introduction to Calculus: Limits, Derivatives, and Integrals37 Questions
Exam 11: P Prerequisites52 Questions
Exam 12: Mathematical Problem Set128 Questions
Select questions type
(a) Explain why direct substitution cannot be used to find the limit
(b) Find the limit algebraically, if it exists.
Free
(Essay)
4.8/5  (34)
(34)
Correct Answer: Verified
(a) is not defined at x=-4 .
(b) 48
The following table lists the population statistics for a certain city.
Year Population 1975 995,855 1985 990,928 1995 942,547 2005 889,370
What is the average rate of change in the population with respect to time between 1975 and 2005 ?
Free
(Short Answer)
4.9/5 (34)
Correct Answer:Verified
-3,549.2
Use a calculator to find the LRAM area approximation for the area under the graph
from x=0 to x=2 with 20 approximating rectangles.
Free
(Short Answer)
4.9/5 (31)
Correct Answer:Verified
12.39
Use a calculator to find the RRAM area approximation for the area under the graph from x=0 to x=2 with 20 approximating rectangles.
(Short Answer)
4.8/5 (39)
Write the integral that would be used to find the shaded area on the graph shown below.
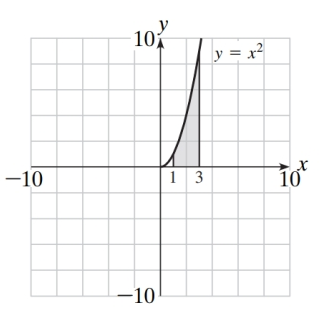
(Short Answer)
4.8/5 (43)
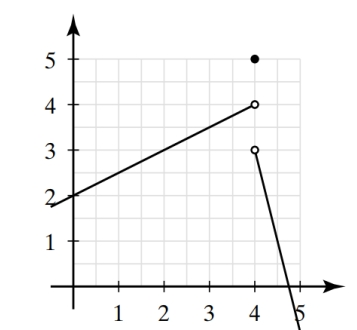
Use the graph below to find the limits or explain why the limits do not exist.
(a)
(b)
(c)
(Essay)
4.8/5 (45)
Draw the graph of over the interval . On the graph, show and shade the rectangles that would be used to approximate the area under the curve over by the right rectangle approximation method using 6 subintervals. Compute the estimation. ![Draw the graph of f(x)=-x(x-3) over the interval [0,3] . On the graph, show and shade the rectangles that would be used to approximate the area under the curve f(x) over [0,3] by the right rectangle approximation method using 6 subintervals. Compute the estimation.](https://storage.examlex.com/TB2920/11eb3ae2_bc83_1907_9b48_b33a6f22e10d_TB2920_00.jpg)
(Essay)
4.9/5 (46)
Find the average rate of change of f(x)=5 \tan x over the interval
(Multiple Choice)
4.7/5 (28)
Write the integral that would be used to find the shaded area on the graph shown below.
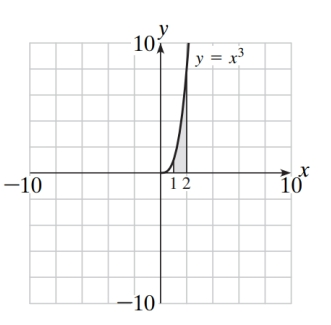
(Short Answer)
4.9/5 (42)
Explain how to find the area under the graph of from x=0 to x=4 by computing the geometric area.
(Essay)
4.8/5 (27)
Compute the integral by computing a geometric area. (Hint: Graph the function first.)
(Short Answer)
4.9/5 (39)
Find the average rate of change of f(x)=3 \cos x over the interval
(Multiple Choice)
4.8/5 (41)
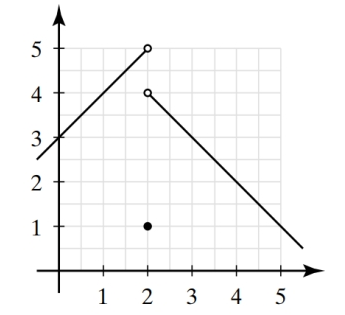
Use the graph below to find the limits or explain why the limits do not exist.
(a)
(b)
(c)
(Essay)
4.8/5 (31)
The following table lists the population statistics for a certain city.
Year Population 1975 695,854 1985 720,928 1995 742,547 2005 750,370
What is the average rate of change in the population with respect to time between 1975 and 2005 ?
(Short Answer)
4.9/5 (49)
What is the average rate of change of over the interval [1.9,2.1] ?
(Short Answer)
4.8/5 (25)
Filters
- Essay(0)
- Multiple Choice(0)
- Short Answer(0)
- True False(0)
- Matching(0)