Exam 12: Nonparametric Statistics
Exam 1: Introduction to Statistics36 Questions
Exam 2: Describing, Exploring, and Comparing Data40 Questions
Exam 3: Probability40 Questions
Exam 4: Discrete Probability Distributions38 Questions
Exam 5: Normal Probability Distributions38 Questions
Exam 6: Estimates and Sample Sizes With One Sample29 Questions
Exam 7: Hypothesis Testing With One Sample39 Questions
Exam 8: Inferences From Two Samples31 Questions
Exam 9: Correlation and Regression25 Questions
Exam 10: Multinomial Experiments and Contingency Tables40 Questions
Exam 11: Analysis of Variance40 Questions
Exam 12: Nonparametric Statistics40 Questions
Exam 13: Life Tables40 Questions
Select questions type
Use the following data for the next questions. Researchers studying sleep loss
followed the length of sleep, in hours, of 10 individuals with insomnia before and
after cognitive behavioral therapy (CBT). Use the Wilcoxon Signed-Ranks Test
with a .05 significance level to test the claim that both samples come from
populations having differences with a median equal to zero.
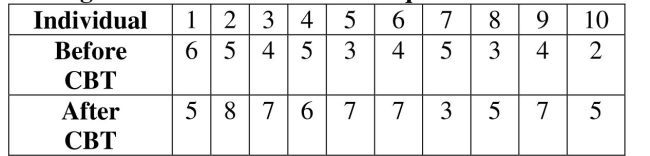 -Determine the value of the T test statistic.
Free
(Short Answer)
5.0/5  (43)
(43)
Correct Answer: Verified
test statistic T = 5
Use the following sample data to answer the next questions. The paired data
consist of the temperatures (in °F ) on randomly chosen days and the growth of
certain kind of plant (in millimeters). Use the Spearman's rank correlation
coefficient to test for a correlation between the temperature and the plant growth.
Use a significance level of 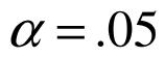
 .
-Determine the value of the
.
-Determine the value of the  test statistic.
Free
(Short Answer)
4.8/5 (37)
Correct Answer:Verified

Use the following sample data to answer the next questions. Certain creeks
tend to accumulate sandbars that block water flow and negatively affect surface
insect habitat. Biologists researching the formation and erosion of these sandbars
attempted to discourage sandbar buildup by installing wood structures that would
increase erosion in the creekbed. Researchers added differing numbers of wood
structures to two similar, adjacent study creeks. The response of surface insects to
the addition of wood structures was then measured by randomly sampling the
weights (in grams) of surface insects at 11 equally-sized locations in the creeks. Use
the Wilcoxon Rank-Sum Test with a .05 significance level to test the claim that,
after adding the wood structures, both creeks have samples that come from
populations with the same median of weights of surface insects.  -Identify the null hypothesis and alternative hypothesis.
Free
(Essay)
4.8/5 (38)
Correct Answer:Verified
H0 : Both creeks have samples that come from populations with equal medians of
weights of surface insects; 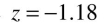 : Both creeks have samples that come from
populations with medians of weights of surface insects that are not equal.
Use the following sample data to answer the next questions. Tracking
misdiagnoses by Emergency Room doctors, a sample of 200 patients revealed that
45 patients were misdiagnosed with indigestion instead of a heart attack. Use the
Sign test with a .05 significance level to test the claim that physicians correctly
diagnose a majority of heart attacks.
-State a conclusion about the null hypothesis and a final conclusion that addresses the original claim.
(Essay)
4.8/5 (27)
Use the following sample data to answer the next questions. Geneticists
studying carriers of genetic diseases followed subjects subdivided by race.
Researchers randomly selected seven patients per race who had been identified as
carrying a certain gene for a genetic disease; these patients were followed to
determine the number of their siblings who also carried the gene for the genetic
disease. Use the Kruskal-Wallis Test at a .05 significance level to test the claim that
the different races have samples that come from populations with equal medians of
siblings who also carry the gene. 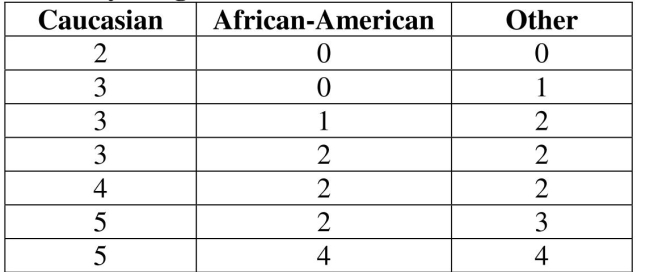 -Determine the value of the H test statistic.
(Short Answer)
4.9/5 (43)
Use the following sample data to answer the next questions. The paired data
consist of the temperatures (in °F ) on randomly chosen days and the growth of
certain kind of plant (in millimeters). Use the Spearman's rank correlation
coefficient to test for a correlation between the temperature and the plant growth.
Use a significance level of .
-Identify the critical value  .
.
(Short Answer)
4.9/5 (36)
Use the following sample data to answer the next questions. The paired data
consist of a random sample of the cost of regionally advertising (in thousands of
dollars) a certain pharmaceutical drug and the number of new prescriptions
written (in thousands). Use the Spearman's rank correlation coefficient to test for
a correlation between the cost of advertising and the number of new prescriptions
written. Use a significance level of 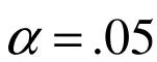
 .
-State a conclusion about the null hypothesis and a final conclusion that addresses the original claim.
.
-State a conclusion about the null hypothesis and a final conclusion that addresses the original claim.
(Essay)
4.9/5 (39)
Use the following sample data to answer the next questions. Tracking
misdiagnoses by Emergency Room doctors, a sample of 200 patients revealed that
45 patients were misdiagnosed with indigestion instead of a heart attack. Use the
Sign test with a .05 significance level to test the claim that physicians correctly
diagnose a majority of heart attacks.
-Determine the value of the z test statistic.
(Short Answer)
4.8/5 (30)
Use the following sample data to answer the next questions. Certain creeks
tend to accumulate sandbars that block water flow and negatively affect fish
habitat. Biologists researching the formation and erosion of these sandbars
attempted to discourage sandbar buildup by installing wood structures that would
increase erosion in the creekbed. Researchers added differing numbers of wood
structures to two similar, adjacent study creeks. Fish response was then measured
by randomly sampling the number of fish at 11 equally-sized portions of the
creeks. Use the Wilcoxon Rank-Sum Test with a .05 significance level to test the
claim that, after adding the wood structures, both creeks have samples that come  from populations with the same median number of native fish.
 -Determine the value of the test statistic.
(Short Answer)
5.0/5 (40)
Use the following data for the next questions. Ophthalmologists studying the
treatment of using an infrared laser procedure in ten patients with vision loss
caused by dry age-related macular degeneration (AMD) found the following data
on visual acuity (VA) before and after the procedure. Use the Wilcoxon Signed-
Ranks Test with a .05 significance level to test the claim that both samples come
from populations having differences with a median equal to zero. 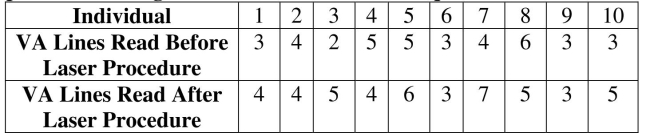 -State a conclusion about the null hypothesis and a final conclusion that addresses the original claim.
(Essay)
4.8/5 (40)
Use the following sample data to answer the next questions. For a study on
Type 1 diabetes, medical graduate students subdivided the United States into four
study regions (Northeast, Southeast, Southwest, and Northwest). The students
randomly selected seven patients per region and recorded the number of times on
a randomly selected day that each patient used insulin shots to regulate blood
sugar levels. Use the Kruskal-Wallis Test at a .05 significance level to test the claim
that the regions have samples that come from populations with equal medians of
number of insulin shots.
Number of times patients used insulin shots to regulate blood sugar levels 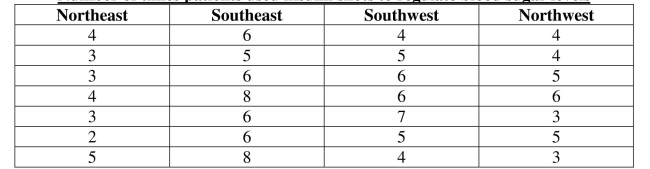 -Identify the null hypothesis and alternative hypothesis.
(Essay)
4.9/5 (33)
Use the following data for the next questions. Researchers studying sleep loss
followed the length of sleep, in hours, of 10 individuals with insomnia before and
after cognitive behavioral therapy (CBT). Use the Wilcoxon Signed-Ranks Test
with a .05 significance level to test the claim that both samples come from
populations having differences with a median equal to zero.
-Identify the critical value T .
(Short Answer)
4.9/5 (34)
Use the following data for the next questions. Ophthalmologists studying the
treatment of using an infrared laser procedure in ten patients with vision loss
caused by dry age-related macular degeneration (AMD) found the following data
on visual acuity (VA) before and after the procedure. Use the Wilcoxon Signed-
Ranks Test with a .05 significance level to test the claim that both samples come
from populations having differences with a median equal to zero.
-Identify the critical value T .
(Short Answer)
4.9/5 (37)
Use the following data for the next questions. Researchers studying sleep loss
followed the length of sleep, in hours, of 10 individuals with insomnia before and
after cognitive behavioral therapy (CBT). Use the Wilcoxon Signed-Ranks Test
with a .05 significance level to test the claim that both samples come from
populations having differences with a median equal to zero.
-Identify the null hypothesis and alternative hypothesis.
(Essay)
4.9/5 (37)
Use the following sample data to answer the next questions. The paired data
consist of the temperatures (in °F ) on randomly chosen days and the growth of
certain kind of plant (in millimeters). Use the Spearman's rank correlation
coefficient to test for a correlation between the temperature and the plant growth.
Use a significance level of .
-Identify the null hypothesis and alternative hypothesis.
(Short Answer)
4.8/5 (32)
Use the following sample data to answer the next questions. For a study on
Type 1 diabetes, medical graduate students subdivided the United States into four
study regions (Northeast, Southeast, Southwest, and Northwest). The students
randomly selected seven patients per region and recorded the number of times on
a randomly selected day that each patient used insulin shots to regulate blood
sugar levels. Use the Kruskal-Wallis Test at a .05 significance level to test the claim
that the regions have samples that come from populations with equal medians of
number of insulin shots.
Number of times patients used insulin shots to regulate blood sugar levels
-Determine the value of the H test statistic.
(Short Answer)
4.8/5 (29)
Use the following sample data to answer the next questions. For a study on
Type 1 diabetes, medical graduate students subdivided the United States into four
study regions (Northeast, Southeast, Southwest, and Northwest). The students
randomly selected seven patients per region and recorded the number of times on
a randomly selected day that each patient used insulin shots to regulate blood
sugar levels. Use the Kruskal-Wallis Test at a .05 significance level to test the claim
that the regions have samples that come from populations with equal medians of
number of insulin shots.
Number of times patients used insulin shots to regulate blood sugar levels
-State a conclusion about the null hypothesis and a final conclusion that addresses the original claim.
(Essay)
4.8/5 (36)
Use the following data for the next questions. Researchers studying sleep loss
followed the length of sleep, in hours, of 10 individuals with insomnia before and
after cognitive behavioral therapy (CBT). Use the Wilcoxon Signed-Ranks Test
with a .05 significance level to test the claim that both samples come from
populations having differences with a median equal to zero.
-State a conclusion about the null hypothesis and a final conclusion that addresses the original claim.
(Essay)
4.9/5 (34)
Use the following sample data to answer the next questions. In order to
evaluate patient response to a course of therapy to treat brain tumors, a sample of
300 patients revealed that 196 patients were responsive to a certain course of
treatment. Use the Sign test with a .05 significance level to test the claim that a
majority of patients with brain tumors were responsive to treatment.
-Identify the  critical value.
(Short Answer)
4.7/5 (34)
Use the following sample data to answer the next questions. Geneticists
studying carriers of genetic diseases followed subjects subdivided by race.
Researchers randomly selected seven patients per race who had been identified as
carrying a certain gene for a genetic disease; these patients were followed to
determine the number of their siblings who also carried the gene for the genetic
disease. Use the Kruskal-Wallis Test at a .05 significance level to test the claim that
the different races have samples that come from populations with equal medians of
siblings who also carry the gene.
-Identify the null hypothesis and alternative hypothesis.
(Essay)
4.9/5 (32)
Filters
- Essay(0)
- Multiple Choice(0)
- Short Answer(0)
- True False(0)
- Matching(0)