Exam 6: Putting Statistics to Work
Exam 1: Thinking Critically195 Questions
Exam 2: Approaches to Problem Solving149 Questions
Exam 3: Numbers in the Real World290 Questions
Exam 4: Managing Money262 Questions
Exam 5: Statistical Reasoning230 Questions
Exam 6: Putting Statistics to Work258 Questions
Exam 7: Probability: Living With the Odds261 Questions
Exam 8: Exponential Astonishment103 Questions
Exam 9: Modeling Our World85 Questions
Exam 10: Modeling With Geometry127 Questions
Exam 11: Mathematics and the Arts62 Questions
Select questions type
State whether you would expect the data set to be normally distributed.
-Times for able bodied female college students to run 400 meters.
(Multiple Choice)
5.0/5  (31)
(31)
Identify the distribution as symmetric, left-skewed, or right-skewed.
-Shoe sizes of adult women
(Multiple Choice)
4.8/5 (45)
Use the range rule of thumb to approximate the standard deviation.
-The maximum value of a distribution is 18.1 and the minimum value is 5.5. Round results to the nearest tenth.
(Multiple Choice)
4.9/5 (41)
Find the mode(s)for the given sample data.
-The table shows the country represented by the winner of the 10,000 meter run in the Summer Olympic Games in various years. Year Country 1912 Finland 1920 Finland 1924 Finland 1928 Finland 1932 Poland 1936 Finland 1948 Czechoslovakia 1952 Czechoslovakia 1956 USSR 1960 USSR 1964 United States 1968 Kenya 1972 Finland 1976 Finland 1980 Ethiopia 1984 Italy 1988 Morocco 1992 Morocco
Find the mode of the country data.
(Multiple Choice)
4.9/5 (41)
Find the standard deviation for the given data. Round your answer to one more decimal place than the original data.
-The numbers listed below represent the amount of precipitation (in inches)last year in six different U.S. cities. 10.4 12.0 31.6 30.2 12.6 22.2
Compute the standard deviation s.
(Multiple Choice)
4.7/5 (43)
Obtain the five-number summary for the given data.
-The normal annual precipitation (in inches)is given below for 21 different U.S. cities. 39.1 30.3 18.5 32.3 27.1 27.8 8.6
23.5 42.6 31.8 20.0 12.0 5.1 13.6
22.3 10.9 16.2 25.4 17.2 14.9 51.7
(Multiple Choice)
4.7/5 (39)
Find the range for the given data.
-The amount that Jeremy has saved in each of the last six months is shown below. \ 115 \ 534 \ 122 \ 599 \ 417 \ 289
(Multiple Choice)
4.9/5 (35)
A hypothesis test is to be performed. State the null and alternative hypotheses.
-A consumer advocacy group believes that the mean volume of juice in a company's 16-ounce juice bottles is actually less than 16 ounces.
(Multiple Choice)
4.8/5 (36)
Provide an appropriate response.
-Draw one boxplot to illustrate bell-shaped data, another for uniform data, and a third for
skewed data. Which of these shapes matches the boxplot for the first 100 digits of π?
(Below is the frequency table for the first 100 digits of π.) 0 1 2 3 4 5 6 7 8 9 8 8 12 11 10 8 9 8 12 14
(Essay)
4.7/5 (35)
Provide an appropriate response.
-Which of the following statements concerning the standard normal curve is/are true (if any)? a. The area under the standard normal curve to the left of is zero.
b. The area under the standard normal curve between any two z-scores is greater than zero.
c. The area under the standard normal curve between two -scores will be negative if both -scores are negative.
d. The area under the standard normal curve to the left of any z-score is less than 1 .
(Multiple Choice)
4.8/5 (41)
A hypothesis test is to be performed. State the null and alternative hypotheses.
-An environmental group believes that the health of the residents of Castletown is adversely affected by the oil refinery in their town. It believes that in Castletown, the proportion of children who suffer from asthma is higher than the nationwide proportion of .
(Multiple Choice)
4.8/5 (36)
Provide an appropriate response.
-Which of the following statements is not true for a left-skewed distribution?
(Multiple Choice)
4.8/5 (35)
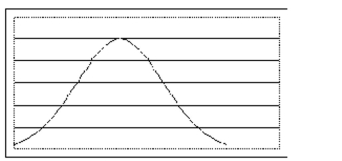
State whether the distribution appears to be (roughly)normal.
-
(Multiple Choice)
4.8/5 (37)
Construct a boxplot as requested.
-The test scores of 40 students are listed below. Construct a boxplot for the data set. 25 35 43 44 47 48 54 55 56 57
59 62 63 65 66 68 69 69 71 72
72 73 74 76 77 77 78 79 80 81
81 82 83 85 89 92 93 94 97 98
(Multiple Choice)
4.9/5 (44)
Use the range rule of thumb to approximate the standard deviation.
-
(Multiple Choice)
4.8/5 (38)
Find the standard score for the given data value.
-A data value in the 8 th percentile.
(Multiple Choice)
4.8/5 (33)
Identify the distribution as symmetric, left-skewed, or right-skewed.
-Age at death for residents of the U.S.
(Multiple Choice)
4.8/5 (43)
Use the range rule of thumb to approximate the standard deviation.
-
(Multiple Choice)
4.8/5 (42)
The result of a hypothesis is described in terms of the probability of obtaining a particular sample. Use the given contextto formulate the null and alternative hypotheses. Discuss whether the sample provides evidence for rejecting the nullhypothesis.
-A consumer group believes that the mean volume of juice in a company's 24 ounce juice
bottles is actually less than 24 ounces.
In a random sample of 310 bottles, the mean volume of juice was 23.9 ounces.
Assuming that the mean volume of juice for all the company's 24-ounce bottles is 24
ounces, the probability of selecting a random sample with a mean volume of 23.9 ounces
or less is 0.00017.
(Essay)
4.8/5 (48)
Filters
- Essay(0)
- Multiple Choice(0)
- Short Answer(0)
- True False(0)
- Matching(0)