Exam 3: Visual Displays of Data Exam
Exam 1: Speaking of Statistics77 Questions
Exam 2: Measurement in Statistics68 Questions
Exam 3: Visual Displays of Data Exam49 Questions
Exam 4: Describing Data64 Questions
Exam 5: A Normal World47 Questions
Exam 6: Probability in Statistics68 Questions
Exam 8: From Samples to Populations60 Questions
Exam 9: Hypothesis Testing60 Questions
Exam 10: T Tests, Two-Way Tables, and Anova41 Questions
Select questions type
Construct a frequency table for the numbers of persons with various blood types. 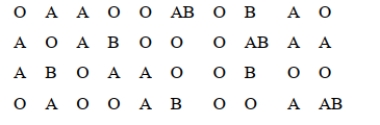
(Essay)
4.9/5  (39)
(39)
The data below is the number of hours of homework done as reported by 24 high school juniors for the last week in September, 2006.
6, 5, 6, 4, 6, 6, 9, 7, 6, 3, 8, 5, 5, 8, 6, 5, 8, 6, 5, 7, 5, 8, 7, 4
Using bins of 2 hours width beginning at 3, construct the cumulative frequency histogram.
(Essay)
4.9/5 (31)
Using the graphical display below.
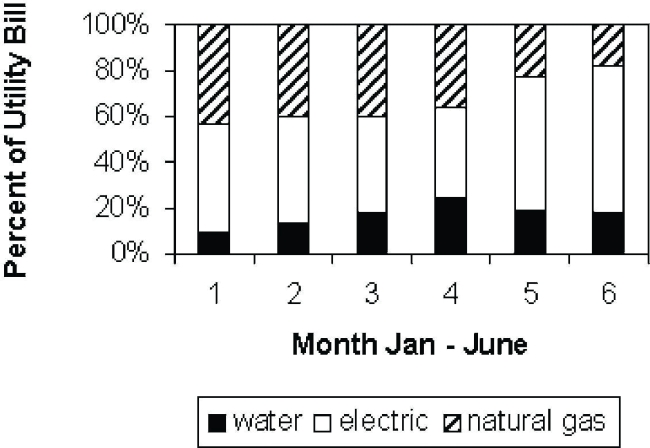 -Identify the utility that accounts for over half the total bill in two months.
(Multiple Choice)
4.8/5 (41)
A car dealer is deciding what kinds of vehicles he should order from the factory. He looks at his sales report for the preceding period. Choose the vertical scale so that the relative frequencies are represented.
Vehicle Sales Economy 16 Sports 4 Family 28 Luxury 8 Truck 24 Construct a Pareto chart to help him decide.
(Essay)
4.8/5 (44)
Alan tossed a die 50 times and obtained the results shown in the dot plot below. 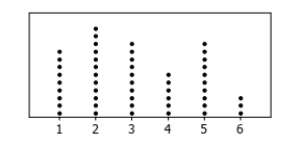 How many times did he roll an even number?
(Short Answer)
4.9/5 (37)
A machine is supposed to fill juice bottles with 16 fluid ounces of juice. The manufacturer picks a sample of bottles that have been filled by the machine and determines the volume of juice in each bottle. The results are shown in the following stem-and-leaf diagram. The leaf unit is 0.1. 15 1 15 233 15 15 667777 15 888899999 16 000000011111 16 222223333 16 445 16 66 16 8 How many bottles were sampled?
(Multiple Choice)
4.8/5 (31)
The stem and leaf plot below shows the weights in pounds of halibut caught on an Alaskan fishing boat for one day.
2|9
3| 12
3| 67788
4| 0233
4| 5567
5| 124
5|
6| 0
List all of the original weights.
(Essay)
4.8/5 (34)
The frequency table shows the weights in ounces of 30 stones. Weight (oz) Number of Stones 1.2-1.6 3 1.7-2.1 2 2.2-2.6 5 2.7-3.1 6 3.2-3.6 14 Construct the relative frequency table from the given frequency table.
(Essay)
5.0/5 (41)
Over the past 4 years of football games the Thunder gained the number of yards rushing as shown in the following table. Yards Frequency 50-99 2 100-149 7 150-199 24 200-249 6 250-300 1 Construct a relative frequency table for these data.
(Essay)
4.8/5 (43)
Filters
- Essay(0)
- Multiple Choice(0)
- Short Answer(0)
- True False(0)
- Matching(0)