Exam 1: Functions
Exam 1: Functions99 Questions
Exam 2: Graphical and Tabular Analysi99 Questions
Exam 3: Straight Lines and Linear Functions100 Questions
Exam 4: Exponential Functions100 Questions
Select questions type
The following table shows average rice yield, in tons per hectare, in Asia  years since 1980. t=years since 1980 5 10 15 20 25 Y= yield 3.32 3.61 3.73 3.95 4.11 Use the average rate of change to estimate the yield in 1993.
(Multiple Choice)
4.9/5  (30)
(30)
Below is a graph of a function . Over what region(s) is the graph concave up? 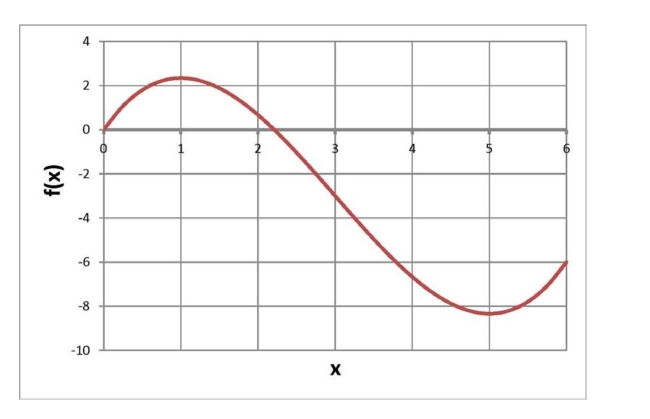
(Multiple Choice)
4.8/5 (38)
Choose the answer that best completes the following sentence. A graph that is decreasing and concave up represents a function that is ...
(Multiple Choice)
4.9/5 (41)
Below is a graph of a function . Find the average rate of change in from 10 to 12 . 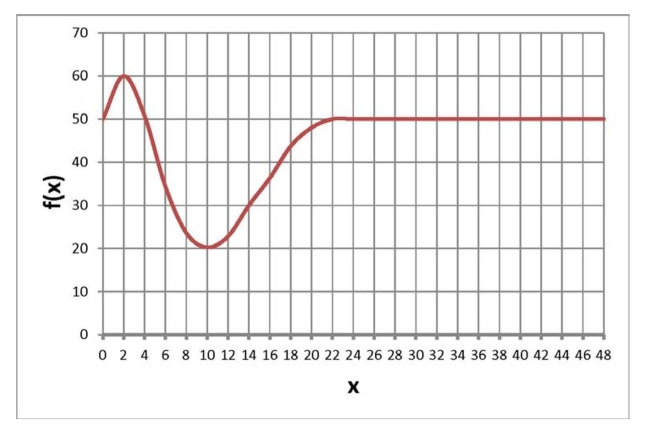
(Multiple Choice)
4.8/5 (45)
The following table shows the U.S. population, in millions, in the given year. d= year 1960 1970 1980 1990 2000 N= popula- tion in mil- lions 179.32 203.3 226.54 248.71 281.42 Use the average rate of change to estimate the U.S. population in 1994.
(Multiple Choice)
4.7/5 (27)
The following table shows the U.S. population, in millions, in the given year. d= year 1960 1970 1980 1990 2000 N= popula- tion in mil- lions 179.32 203.3 226.54 248.71 281.42 Use the average rate of change to estimate the U.S. population in 1992.
(Multiple Choice)
4.8/5 (31)
If you work 45 hours per week, then your weekly pay p , in dollars, is proportional to your hourly wage , in dollars per hour. Express this proportionality relationship as a formula.
(Multiple Choice)
4.7/5 (34)
A balloon that originally holds 13.6 cubic inches of air springs a leak. Let represent the volume, in cubic inches, of air in the balloon  minutes after the balloon starts to leak air. The average rate
Of change of is cubic inches per minute. Use these facts to estimate .
minutes after the balloon starts to leak air. The average rate
Of change of is cubic inches per minute. Use these facts to estimate .
(Multiple Choice)
4.8/5 (46)
The following table shows your monthly payment P, in dollars, if you pay off a loan in  months.
 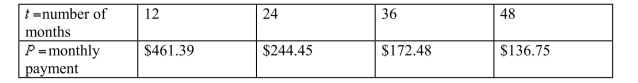 Which formula below fits these data?
(Multiple Choice)
4.7/5 (35)
Choose the answer that best completes the following sentence. A graph that is decreasing and concave up represents a function that is ...
(Multiple Choice)
4.7/5 (45)
Below is a graph of a function . Find the average rate of change in from 2 to 4 . 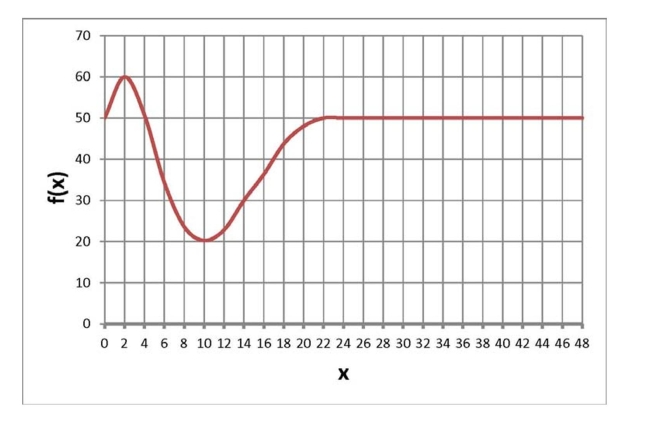
(Multiple Choice)
4.9/5 (31)
Below is a graph of a function . Find the average rate of change in from 2 to 4 . 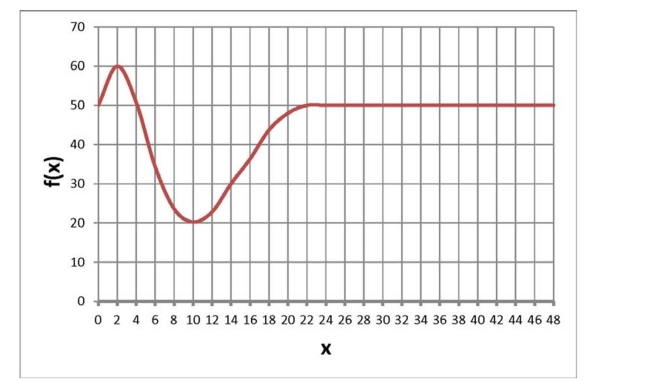
(Multiple Choice)
4.8/5 (44)
Filters
- Essay(0)
- Multiple Choice(0)
- Short Answer(0)
- True False(0)
- Matching(0)