Exam 4: Linear Functions and Inequalities in Two Variables
Exam 1: Real Numbers and Variable Expressions181 Questions
Exam 2: First-Degree Equations and Inequalities141 Questions
Exam 3: Geometry79 Questions
Exam 4: Linear Functions and Inequalities in Two Variables92 Questions
Exam 5: Systems of Linear Equations and Inequalities36 Questions
Exam 6: Polynomials104 Questions
Exam 7: Factoring112 Questions
Exam 8: Rational Expressions111 Questions
Exam 9: Exponents and Radicals94 Questions
Exam 10: Quadratic Equations76 Questions
Exam 11: Functions and Relations62 Questions
Exam 12: Exponential and Logarithmic Functions71 Questions
Select questions type
Find the equation of the line that contains the given point and has the given slope. (-4, 21) , m = -4.
(Multiple Choice)
4.9/5  (26)
(26)
A custom-illustrated sign or banner can be commissioned for a cost of $21.00 for the material and $11.90 per square foot for artwork. The equation that represents this cost is given by y = 11.90x + 21.00, where y is the cost and x is the number of square feet in the sign. When this equation is graphed for  , the ordered pair (13, 175.70) is discovered to lie on the graph. Write a sentence that describes the meaning of the ordered pair (13, 175.70).
(Multiple Choice)
4.8/5 (29)
The graph below shows the relationship between the temperature (degrees Fahrenheit) inside an oven and the time since the oven was turned off. Find the slope of the line between the two points shown on the graph, namely (20, 275) and (50, 125). Write a sentence that states the meaning of the slope. 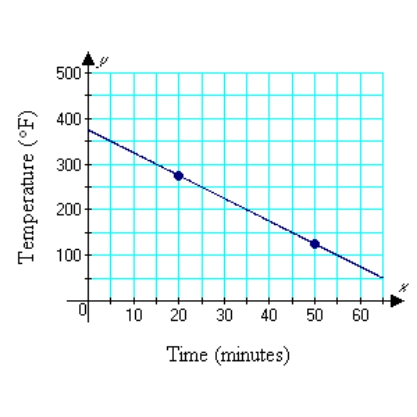
(Multiple Choice)
4.8/5 (30)
Find the equation of the line that contains the points P1(-2, -4) and P2(3, -7).
(Multiple Choice)
4.9/5 (38)
Find the equation of the line containing the point (3, 1) and parallel to the line  .
.
(Multiple Choice)
4.7/5 (33)
The number of years of previous work experience and the monthly salary of a person who completes a bachelor's degree in economics are recorded in the following table. Graph the scatter diagram of these data. 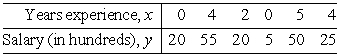
(Multiple Choice)
4.9/5 (40)
Filters
- Essay(0)
- Multiple Choice(0)
- Short Answer(0)
- True False(0)
- Matching(0)