Exam 3: Empirical Methods for Demand Analysis
Exam 1: Introduction40 Questions
Exam 2: Supply and Demand129 Questions
Exam 3: Empirical Methods for Demand Analysis85 Questions
Exam 4: Consumer Choice71 Questions
Exam 5: Production128 Questions
Exam 6: Costs117 Questions
Exam 7: Firm Organization and Market Structure80 Questions
Exam 8: Competitive Firms and Markets98 Questions
Exam 9: Monopoly82 Questions
Exam 10: Pricing With Market Power137 Questions
Exam 11: Oligopoly and Monopolistic Competition84 Questions
Exam 12: Game Theory and Business Strategy90 Questions
Exam 13: Strategies Over Time67 Questions
Exam 14: Managerial Decision-Making Under Uncertainty116 Questions
Exam 15: Asymmetric Information114 Questions
Exam 16: Government and Business106 Questions
Exam 17: Global Business72 Questions
Select questions type
If two variables B and V are negatively correlated, B ________ when V ________.
(Multiple Choice)
4.9/5  (30)
(30)
The percentage change in the quantity demanded in response to a percentage change in the price is known as the
(Multiple Choice)
4.8/5 (27)
The random error term ________ the effects of ________ influences on the dependent variable that are not included as explanatory variables.
(Multiple Choice)
4.8/5 (43)
If a consumer increases her quantity of ice cream consumed by 100% when her income rises by 25%, then her income elasticity of demand for ice cream is
(Multiple Choice)
4.8/5 (34)
Two variables are said to be ________ if they move together.
(Multiple Choice)
4.8/5 (37)
Sometimes distinct patterns around a trend line can be caused by
(Multiple Choice)
4.8/5 (35)
An estimated demand curve does NOT necessarily match actual data perfectly because
(Multiple Choice)
4.9/5 (38)
If the price of a slice of pizza rises from $2.50 to $3, and quantity demanded falls from 10,000 slices to 7,400 slices, using the formula for arc price elasticity, what is the percentage change in price?
(Multiple Choice)
5.0/5 (32)
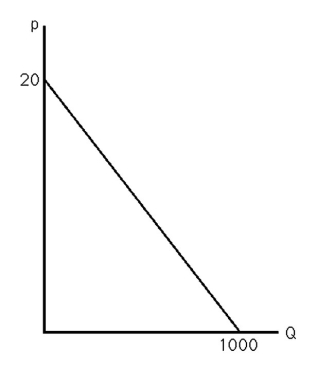 -The above figure shows the demand curve for crude oil. The demand curve has unitary price elasticity when price equals
(Multiple Choice)
4.8/5 (25)
The gap between the actual and predicted values of a dependent variable is called
(Multiple Choice)
4.9/5 (45)
If the price of orange juice rises 10%, and as a result the quantity demanded falls by 8%, the price elasticity of demand for orange juice is
(Multiple Choice)
4.9/5 (32)
If an estimated regression explains none of the variation, R2 will be
(Multiple Choice)
5.0/5 (45)
If the demand for orange juice is expressed as Q = 2000 - 500p, where Q is measured in gallons and p is measured in dollars, then at the price of $3, the demand curve
(Multiple Choice)
4.9/5 (28)
Filters
- Essay(0)
- Multiple Choice(0)
- Short Answer(0)
- True False(0)
- Matching(0)