Exam 12: Aggregate Demand Ii: Applying the Islm Model
Exam 1: The Science of Macroeconomics58 Questions
Exam 2: The Data of Microeconomics108 Questions
Exam 3: National Income: Where It Comes From and Where It Goes159 Questions
Exam 4: The Monetary System: What It Is and How It Works99 Questions
Exam 5: Inflation: Its Causes, Effects, and Social Costs86 Questions
Exam 6: The Open Economy102 Questions
Exam 7: Unemployment and the Labour Market90 Questions
Exam 8: Economic Growth I: Capital Accumulation and Population Growth99 Questions
Exam 9: Economic Growth II: Technology, Empirics, and Policy83 Questions
Exam 10: Introduction to Economic Fluctuations94 Questions
Exam 11: Aggregate Demand I: Building the Islm Model87 Questions
Exam 12: Aggregate Demand Ii: Applying the Islm Model92 Questions
Exam 13: The Open Economy Revisited: the Mundellfleming Model and the Exchange-Rate Regime106 Questions
Exam 14: Aggregate Supply and the Short-Run Tradeoff Between Inflation and Unemployment88 Questions
Exam 15: A Dynamic Model of Economic Fluctuations83 Questions
Exam 16: Alternative Perspectives on Stabilization Policy78 Questions
Exam 17: Government Debt and Budget Deficits75 Questions
Exam 18: The Financial System: Opportunities and Dangers92 Questions
Exam 19: The Microfoundations of Consumption and Investment112 Questions
Select questions type
Suppose that people finally realize that they must save a larger proportion of their income in order to retire and that they simultaneously begin to use new technology that allows them to reduce their holdings of real cash balances as a proportion of their income. Use the IS-LM model to illustrate graphically the impact of these two changes in household behaviour on output and interest rates. Be sure to label: i. the axes; ii. the curves; iii. the initial equilibrium values; iv. the direction the curves shift; and v. the terminal equilibrium values.
(Essay)
4.8/5  (37)
(37)
Exhibit: IS-LM Monetary Policy 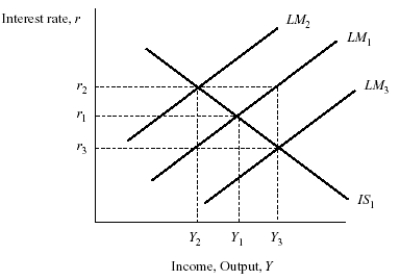 Based on the graph, starting from equilibrium at interest rate r1 and income Y1, a decrease in the money supply would generate the new equilibrium combination of interest rate and income:
(Multiple Choice)
4.9/5 (41)
Two identical countries, Alpha and Beta, can be described by the IS-LM model in the short run. The governments of both countries cut taxes by the same amount. The Central Bank of Alpha follows a policy of holding a constant money supply. The Central Bank of Beta follows a policy of holding a constant interest rate. Compare the impact of the tax cut on income and interest rates in the two countries.
(Essay)
4.9/5 (27)
If real money balances enter the IS-LM model both through the theory of liquidity preference and the Pigou effect, then a fall in the price level will shift:
(Multiple Choice)
4.9/5 (35)
In the IS-LM model, a decrease in output would be the result of a(n):
(Multiple Choice)
4.9/5 (44)
Use the IS-LM model to illustrate graphically the impact on output and interest rates of a one-time increase in the price level due to a large increase in oil prices. Be sure to label: i. the axes; ii. the curves; iii. the initial equilibrium values; iv. the direction the curves shift; and v. the terminal equilibrium values.
(Essay)
4.8/5 (34)
Assume that the economy is initially in short-run equilibrium at a level of output above the natural rate. Use the IS-LM model to illustrate graphically how the levels of income and interest rates change as the economy returns to the natural rate of output in the long run.
(Essay)
4.9/5 (34)
Other things equal, a given change in government spending has a larger effect on demand the:
(Multiple Choice)
4.8/5 (35)
If consumption is given by C = 200 + 0.75(Y - T) and investment is given by I = 200 - 25r, then the formula for the IS curve is:
(Multiple Choice)
4.8/5 (29)
The debt-deflation theory of the Great Depression suggests that an _____ deflation redistributes wealth in such a way as to _____ spending on goods and services.
(Multiple Choice)
4.9/5 (29)
If the demand function for money is M / P = 0.2Y - 200r, and if M / P increases by 100, then the LM curve for any given interest rate shifts to the:
(Multiple Choice)
4.9/5 (37)
Assume that initially everyone expects the price level to stay the same. Now the Bank of Canada announces that it will increase the rate of money growth in one year. People now expect inflation. Use the IS-LM model to illustrate graphically the impact of expected inflation on the level of output and on the real and nominal interest rates.
(Essay)
4.8/5 (37)
If inflation is bad, why isn't deflation good? Use the IS-LM model to explain how deflation could result in a contraction in output.
(Essay)
4.8/5 (42)
Exhibit: Policy Interaction 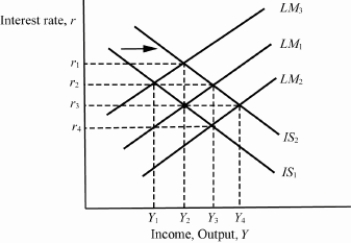 Based on the graph, starting from equilibrium at interest rate r3, income Y2, IS1, and LM1, if there is an increase in government spending that shifts the IS curve to IS2, then in order to keep the interest rate constant, the Bank of Canada should _____ the money supply, shifting to _____.
(Multiple Choice)
4.9/5 (38)
In the IS-LM model when the Bank of Canada decreases the money supply, the public _____ bonds, and the interest rate _____, leading to a(n) _____ in investment and income. This is called the monetary transmission mechanism.
(Multiple Choice)
4.7/5 (34)
Assume that an economy is described by the IS curve Y = 3,600 + 3G - 2T - 150r and the LM curve Y = 2 M / P + 100r [or r = 0.01Y - 0.02 (M / P)]. The investment function for this economy is 1,000 - 50r. The consumption function is C = 200 + (2 / 3)(Y - T). Long-run equilibrium output for this economy is 4,000. The price level is 1.0.
a.Assume that government spending is fixed at 1,200. The government wants to achieve a level of investment equal to 900 and also achieve Y = 4,000. What level of r is needed for I = 900? What levels of T and M must be set to achieve the two goals? What will be the levels of private saving, public saving, and national saving?
(Essay)
4.9/5 (30)
In the IS-LM model, a decrease in the interest rate would be the result of a(n):
(Multiple Choice)
4.8/5 (30)
Exhibit: IS-LM Fiscal Policy 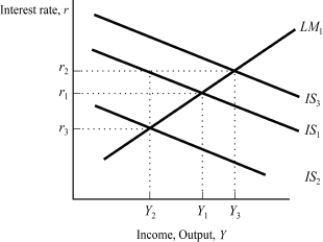 Based on the graph, starting from equilibrium at interest rate r1 and income Y1, a decrease in government spending would generate the new equilibrium combination of interest rate and income:
(Multiple Choice)
4.8/5 (28)
Filters
- Essay(0)
- Multiple Choice(0)
- Short Answer(0)
- True False(0)
- Matching(0)