Exam 12: Aggregate Demand Ii: Applying the Islm Model
Exam 1: The Science of Macroeconomics58 Questions
Exam 2: The Data of Microeconomics108 Questions
Exam 3: National Income: Where It Comes From and Where It Goes159 Questions
Exam 4: The Monetary System: What It Is and How It Works99 Questions
Exam 5: Inflation: Its Causes, Effects, and Social Costs86 Questions
Exam 6: The Open Economy102 Questions
Exam 7: Unemployment and the Labour Market90 Questions
Exam 8: Economic Growth I: Capital Accumulation and Population Growth99 Questions
Exam 9: Economic Growth II: Technology, Empirics, and Policy83 Questions
Exam 10: Introduction to Economic Fluctuations94 Questions
Exam 11: Aggregate Demand I: Building the Islm Model87 Questions
Exam 12: Aggregate Demand Ii: Applying the Islm Model92 Questions
Exam 13: The Open Economy Revisited: the Mundellfleming Model and the Exchange-Rate Regime106 Questions
Exam 14: Aggregate Supply and the Short-Run Tradeoff Between Inflation and Unemployment88 Questions
Exam 15: A Dynamic Model of Economic Fluctuations83 Questions
Exam 16: Alternative Perspectives on Stabilization Policy78 Questions
Exam 17: Government Debt and Budget Deficits75 Questions
Exam 18: The Financial System: Opportunities and Dangers92 Questions
Exam 19: The Microfoundations of Consumption and Investment112 Questions
Select questions type
The Pigou effect suggests that falling prices will increase income because real balances influence _____ and will shift the _____ curve.
(Multiple Choice)
4.7/5  (35)
(35)
The interaction of the IS curve and the LM curve determines:
(Multiple Choice)
4.8/5 (35)
The aggregate demand curve generally slopes downward and to the right because, for any given money supply M, a higher price level P causes a _____ real money supply M / P, which _____ the interest rate and _____ spending.
(Multiple Choice)
4.8/5 (32)
Using the IS-LM analysis, if the LM curve is not horizontal, the multiplier for an increase in government spending is _____ for an increase in government purchases using the Keynesian-cross analysis.
(Multiple Choice)
4.9/5 (31)
Exhibit: Short Run to Long Run 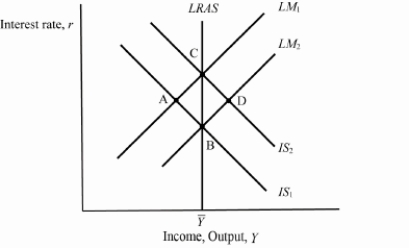 Based on the graph, if the economy starts from a short-term equilibrium at A, then the long-run equilibrium will be at _____, with a _____ price level.
(Multiple Choice)
4.7/5 (34)
In the IS-LM model when M / P rises, in short-run equilibrium, in the usual case the interest rate _____ and output _____.
(Multiple Choice)
4.7/5 (29)
In the IS-LM model in a closed economy, an increase in government spending increases the interest rate and crowds out:
(Multiple Choice)
4.9/5 (38)
If MPC = 0.6 (and there are no income taxes but only lump-sum taxes) when T decreases by 200, then the IS curve for any given interest rate shifts to the right by:
(Multiple Choice)
4.9/5 (37)
An increase in consumer saving for any given level of income will shift the:
(Multiple Choice)
4.8/5 (35)
A movement along an aggregate demand curve corresponds to a change in income in the IS-LM model _____, while a shift in an aggregate demand curve corresponds to a change in income in the IS-LM model _____.
(Multiple Choice)
4.9/5 (34)
According to the IS-LM model, when the government increases taxes and government purchases by equal amounts:
(Multiple Choice)
4.7/5 (32)
How can the Bank of Canada keep the economy from falling into a recession if the budget deficit is reduced? Use the IS-LM model to illustrate graphically the impact of both the fiscal policy reducing the deficit and the monetary policy, which prevents output from falling. Be sure to label: i. the axes; ii. the curves; iii. the initial equilibrium values; iv. the direction the curves shift; and v. the terminal equilibrium values.
(Essay)
4.8/5 (27)
If MPC = 0.6 (and there are no income taxes) when G increases by 200, then the IS curve for any given interest rate shifts to the right by:
(Multiple Choice)
5.0/5 (33)
Starting from a short-run equilibrium greater than the natural rate of output, as the economy returns to a long-run equilibrium:
(Multiple Choice)
4.9/5 (29)
Exhibit: Policy Interaction 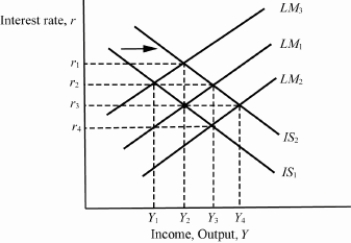 Based on the graph, starting from equilibrium at interest rate r3, income Y2, IS1, and LM1, if there is an increase in government spending that shifts the IS curve to IS2, then in order to keep output constant, the Bank of Canada should _____ the money supply, shifting to _____.
(Multiple Choice)
4.9/5 (44)
One policy response to an economic slowdown is to cut taxes. This policy response can be represented in the IS-LM model by shifting the _____ curve to the _____.
(Multiple Choice)
4.9/5 (31)
Assume the following model of the economy, with the price level fixed at 1.0:
C = 0.8(Y - T)
T = 1,000
I = 800 - 20r
G = 1,000
Y = C + I + G
Ms / P = Md / P = 0.4Y - 40r
Ms = 1,200
a.Write a formula for the IS curve, showing Y as a function of r alone.
(Essay)
4.8/5 (43)
If the IS curve is given by Y = 1,700 - 100r and the LM curve is given by Y = 500 + 100r, then equilibrium income and interest rate are given by:
(Multiple Choice)
4.9/5 (39)
Economists who believe that fiscal policy is more potent than monetary policy argue that the:
(Multiple Choice)
5.0/5 (30)
Filters
- Essay(0)
- Multiple Choice(0)
- Short Answer(0)
- True False(0)
- Matching(0)