Exam 5: Efficiency and Equity
Exam 1: What Is Economics483 Questions
Exam 2: The Economic Problem440 Questions
Exam 3: Demand and Supply515 Questions
Exam 4: Elasticity530 Questions
Exam 5: Efficiency and Equity450 Questions
Exam 6: Government Actions in Markets412 Questions
Exam 7: Global Markets in Action205 Questions
Exam 8: Utility and Demand366 Questions
Exam 10: Organizing Production385 Questions
Exam 11: Output and Costs493 Questions
Exam 12: Perfect Competition487 Questions
Exam 13: Monopoly599 Questions
Exam 14: Monopolistic Competition318 Questions
Exam 15: Oligopoly276 Questions
Exam 16: Public Choices, Public Goods, and Healthcare205 Questions
Exam 17: Externalities437 Questions
Exam 18: Markets for Factors of Production382 Questions
Exam 19: Economic Inequality351 Questions
Exam 20: Uncertainty and Information233 Questions
Select questions type
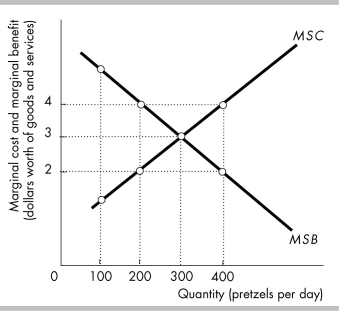 -In the above figure, what is the efficient quantity of pretzels to produce each day?
(Multiple Choice)
4.9/5  (37)
(37)
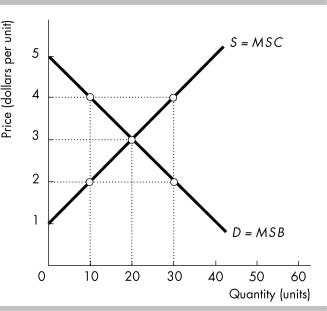 -In the above figure, suppose that the government sets a limit that may be produced of 10 units of output and the price rises to $4. In comparison to a competitive market the producer surplus would rise by
(Multiple Choice)
4.8/5 (42)
"A demand curve is the same as a marginal cost curve." Is this statement correct or incorrect? Explain your answer.
(Essay)
4.9/5 (42)
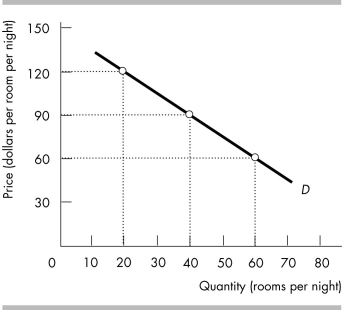 -The figure shows the demand curve for hotel rooms at a local resort.
a) If the hotel charges $120 per night, how many rooms will they rent?
b) If there are only 40 rooms available, how much are customers willing to pay for a room?
c) If 60 rooms are available, how much are customers willing to pay?
d) What do the dollars in your answer to part (c) represent?
-The figure shows the demand curve for hotel rooms at a local resort.
a) If the hotel charges $120 per night, how many rooms will they rent?
b) If there are only 40 rooms available, how much are customers willing to pay for a room?
c) If 60 rooms are available, how much are customers willing to pay?
d) What do the dollars in your answer to part (c) represent?
(Essay)
4.9/5 (44)
At the beginning of World War II, a rationing system was established in the United States. Ration stamps or cards were issued for a variety of commodities such as canned milk and gasoline. To receive a gasoline ration card, a person had to certify a need for gas. The ration cards ranged from the most limited A card which only allowed 3 to 4 gallons per week to the most generous X card, which allowed the carrier to buy an unlimited amount of gasoline. A government entity, the War Price and Rationing Board, decided who received and A or an X card. Gasoline cards were allocated through
(Multiple Choice)
4.8/5 (38)
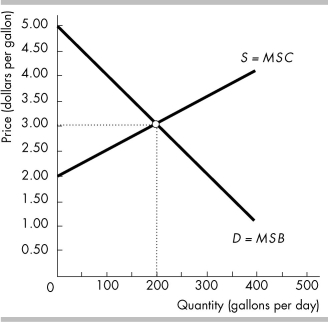 -The figure above shows the market for milk. If 250 gallons of milk a day are available, the ________ price that consumers are willing to pay for the last gallon is ________.
(Multiple Choice)
4.9/5 (37)
Market failure is the situation in which a market delivers an inefficient outcome.
(True/False)
4.9/5 (41)
A firm that is the only seller of a product and is in sole control of a market has a
(Multiple Choice)
4.8/5 (38)
Producer surplus is the price received ________ summed over the quantity sold.
(Multiple Choice)
4.8/5 (28)
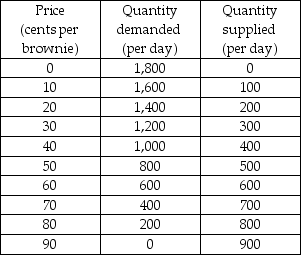 -In the above table, what is the minimum price that producers must be offered to produce the 200th brownie?
(Multiple Choice)
4.8/5 (35)
If there are no external costs or benefits, no price or quantity regulations, no taxes or subsidies, and the good is not a public good or a common resource, then efficiency is
(Multiple Choice)
4.7/5 (43)
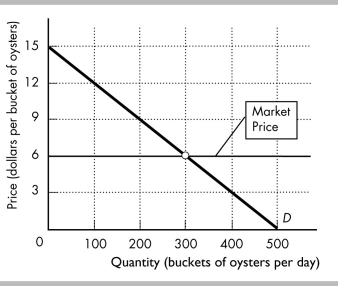 -The diagram above depicts the market demand for, and market price of, buckets of raw oysters in Orlando.
a) What is the consumer surplus of the person who buys the 100th bucket of oysters?
b) What is the consumer surplus of the person who buys the 200th bucket of oysters?
c) What is the consumer surplus of the person who buys the 300th bucket of oysters?
d) What is the consumer surplus in the market?
-The diagram above depicts the market demand for, and market price of, buckets of raw oysters in Orlando.
a) What is the consumer surplus of the person who buys the 100th bucket of oysters?
b) What is the consumer surplus of the person who buys the 200th bucket of oysters?
c) What is the consumer surplus of the person who buys the 300th bucket of oysters?
d) What is the consumer surplus in the market?
(Essay)
4.8/5 (37)
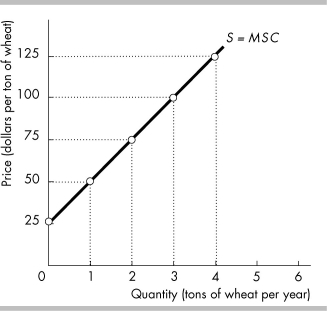 -In the above figure, the marginal cost of the second ton of wheat is
(Multiple Choice)
4.7/5 (34)
If the market for roller blades is at a competitive equilibrium, and there are no external costs or benefits, then
(Multiple Choice)
4.9/5 (32)
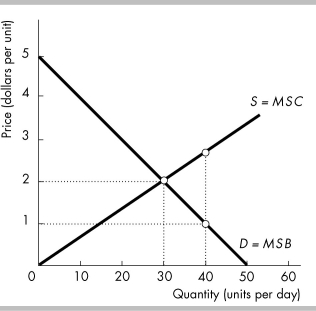 -In the above figure, at the equilibrium price and quantity, consumer surplus is
(Multiple Choice)
4.9/5 (35)
Overproduction compared to the efficient amount implies that for the last unit produced
(Multiple Choice)
4.8/5 (35)
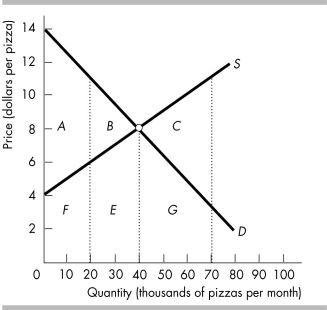 -The figure above shows the market supply and market demand for pizza.
a) What is the efficient quantity of pizzas?
b) If 70,000 pizzas are produced, what area represents the deadweight loss?
c) Why does the deadweight loss in part (b) occur?
d) If 20,000 pizzas are produced, what area represents the deadweight loss?
e) Why does the deadweight loss in part (d) occur?
-The figure above shows the market supply and market demand for pizza.
a) What is the efficient quantity of pizzas?
b) If 70,000 pizzas are produced, what area represents the deadweight loss?
c) Why does the deadweight loss in part (b) occur?
d) If 20,000 pizzas are produced, what area represents the deadweight loss?
e) Why does the deadweight loss in part (d) occur?
(Essay)
4.9/5 (32)
Filters
- Essay(0)
- Multiple Choice(0)
- Short Answer(0)
- True False(0)
- Matching(0)