Exam 11: Prerequisites
Exam 1: Functions and Their Graphs150 Questions
Exam 2: Solving Equations and Inequalities150 Questions
Exam 3: Polynomial and Rational Functions150 Questions
Exam 4: Exponential and Logarithmic Functions150 Questions
Exam 5: Trigonometric Functions150 Questions
Exam 6: Analytic Trigonometry150 Questions
Exam 7: Additional Topics in Trigonometry150 Questions
Exam 8: Linear Systems and Matrices150 Questions
Exam 9: Sequences, Series, and Probability150 Questions
Exam 10: Topics in Analytic Geometry150 Questions
Exam 11: Prerequisites150 Questions
Select questions type
The double bar graph below shows the percents of associate degrees awarded to males and females for selected fields of study in the United States in 2003. Degrees awarded to females are graphed above degrees awarded to males.  How many fields of study were less than 40% male?
Free
(Multiple Choice)
4.7/5  (33)
(33)
Correct Answer: Verified
A
Simplify the radical expression. 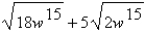
Free
(Multiple Choice)
4.9/5 (34)
Correct Answer:Verified
D
Use absolute value notation to describe the situation. The elevation at the bottom of a mountain is 128 feet above sea level. The elevation at the top of the mountain is 3255 feet above sea level. What is the height of the mountain?
Free
(Multiple Choice)
4.8/5 (32)
Correct Answer:Verified
E
Factor the expression by removing the common factor with the smaller exponent. 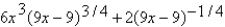
(Multiple Choice)
4.9/5 (35)
Approximate the numbers and place the correct symbol (< or >) between them. 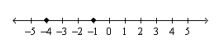
(Multiple Choice)
4.9/5 (30)
The double bar graph below shows the percents of associate degrees awarded to males and females for selected fields of study in the United States in 2003. Degrees awarded to females are graphed above degrees awarded to males. 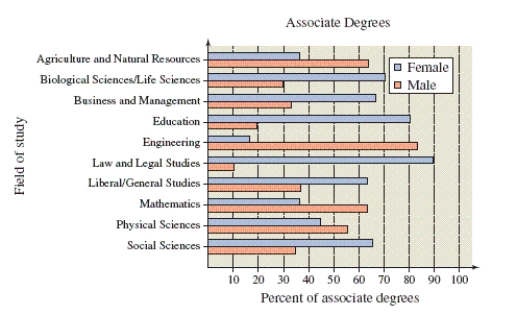 How many fields of study were more than 60% male?
(Multiple Choice)
4.8/5 (28)
Factor the expression by removing the common factor with the smaller exponent. 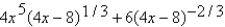
(Multiple Choice)
4.8/5 (40)
Identify the degree and leading coefficient of the polynomial. 
(Multiple Choice)
4.8/5 (33)
Approximate the numbers and place the correct symbol (< or >) between them. 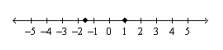
(Multiple Choice)
4.8/5 (27)
The line graph shows the costs of a 30-second television spot (in thousands of dollars) during the Super Bowl from 1995 to 2005. 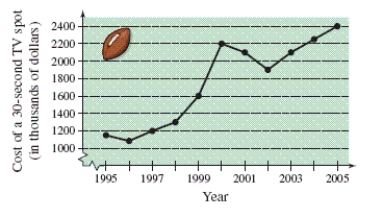 Estimate the increase in the cost of a 30-second spot from the Super Bowl in 2000 to the Super Bowl in 2005.
(Multiple Choice)
4.9/5 (33)
Factor the expression by removing the common factor with the smaller exponent. 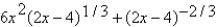
(Multiple Choice)
4.8/5 (31)
Determine which numbers in the set are integers. -1.81, 4,  , 0,
, 0,  , -3
, -3
(Multiple Choice)
4.7/5 (46)
List the coefficients of the variable terms in the expression: 
(Multiple Choice)
4.7/5 (36)
Identify the rules of algebra illustrated from left to right by the following statement. 
(Multiple Choice)
4.9/5 (33)
Filters
- Essay(0)
- Multiple Choice(0)
- Short Answer(0)
- True False(0)
- Matching(0)