Exam 22: The Theory of Consumer Choice
Exam 1: Ten Lessons From Economics146 Questions
Exam 2: Thinking Like an Economist133 Questions
Exam 3: Interdependence and the Gains From Trade139 Questions
Exam 4: The Market Forces of Supply and Demand215 Questions
Exam 5: Elasticity and Its Application178 Questions
Exam 6: Supply, Demand and Government Policies145 Questions
Exam 7: Consumers, Producers and the Efficiency of Markets171 Questions
Exam 8: Application: the Costs of Taxation135 Questions
Exam 9: Application: International Trade151 Questions
Exam 10: Externalities199 Questions
Exam 11: Public Goods and Common Resources178 Questions
Exam 12: The Design of the Tax System154 Questions
Exam 13: The Costs of Production191 Questions
Exam 14: Firms in Competitive Markets198 Questions
Exam 15: Monopoly212 Questions
Exam 16: Monopolistic Competition212 Questions
Exam 17: Business Strategy and Oligopoly179 Questions
Exam 18: Competition Policy103 Questions
Exam 19: The Markets for the Factors of Production214 Questions
Exam 20: Earnings, Unions and Discrimination201 Questions
Exam 21: Income Inequity and Poverty111 Questions
Exam 22: The Theory of Consumer Choice158 Questions
Exam 23: Frontiers of Microeconomics111 Questions
Exam 24: Measuring a Nations Income51 Questions
Exam 25: Measuring the Cost of Living55 Questions
Exam 26: Production and Growth62 Questions
Exam 27: Saving, Investment and the Financial System62 Questions
Exam 28: The Natural Rate of Unemployment58 Questions
Exam 29: The Monetary System66 Questions
Exam 30: Inflation: Its Causes and Costs74 Questions
Exam 31: Open-Economy Macroeconomics: Basic Concepts68 Questions
Exam 32: A Macroeconomic Theory of the Open Economy61 Questions
Exam 33: Aggregate Demand and Aggregate Supply81 Questions
Exam 34: The Influence of Monetary and Fiscal Policy on Aggregate Demand73 Questions
Exam 35: The Short-Run Trade-Off Between Inflation and Unemployment57 Questions
Exam 36: Global Financial Crisis of 2008 and Beyond37 Questions
Exam 37: Five Debates Over Macroeconomic Policy38 Questions
Select questions type
Janet knows that she will ultimately face retirement.Assume that Janet will experience two periods in her life, one in which she works and earns income, and one in which she is retired and earns no income.Janet can earn $250 000 during her work period and nothing in her retirement period.She must both save and consume in her work period, and can earn 10 per cent interest on her savings.
a.Use a graph to demonstrate Janet's budget constraint.
b.On your graph, show Janet at an optimal level of consumption in the work period equal to
$150 000.What is the implied optimal level of consumption in her retirement period?
c.Now, using your graph from part b above, demonstrate how Janet will be affected by an increase in the interest rate on savings to 15 per cent.Discuss the role of income and substitution effects in determining whether Janet will increase or decrease her savings in the work period.
(Essay)
4.8/5  (34)
(34)
An upward-sloping individual labour supply curve is indicative of:
(Multiple Choice)
4.8/5 (39)
As a general rule, the theory of consumer choice provides insight into the behaviour of:
(Multiple Choice)
4.8/5 (41)
When two goods are perfect substitutes, the marginal rate of substitution:
(Multiple Choice)
4.8/5 (36)
Graph 22-6  -Refer to Graph 22-6.In the figure shown, an optimising consumer is most likely to select the consumption bundle associated with:
(Multiple Choice)
4.7/5 (40)
Which of the commodities below is most likely to be categorised as an inferior good?
(Multiple Choice)
4.9/5 (37)
If the income effect and substitution effect work in the same direction, then the good in question is a:
(Multiple Choice)
4.9/5 (39)
The budget constraints shows the different possible combinations of goods that can be consumed at current prices and using all the consumer's income.
(True/False)
4.9/5 (35)
Graphically demonstrate the conditions associated with a consumer optimum.Carefully label all curves and axes.
(Essay)
4.9/5 (38)
One reason an individual labour supply curve may be backward-sloping is that:
(i) work hours decline as technology raises worker productivity
(ii) a raise may prompt a person to devote more time to leisure than to work
(iii) a wage fall may cause a person to not work as hard
(Multiple Choice)
4.9/5 (43)
Graph 22-8  -Refer to Graph 22-8.If the consumer is currently at point A on the graph shown, a change to point B as a result of a decrease in the price of potato chips would show the:
(Multiple Choice)
4.8/5 (33)
When leisure is a normal good, the income effect from an increase in wages is manifest in a(n):
(Multiple Choice)
4.7/5 (45)
When indifference curves are bowed inward toward the origin:
(Multiple Choice)
4.8/5 (47)
Because indifference curves are linear for each type of good, the marginal rate of substitution is the same at all points on a given indifference curve.
(True/False)
4.9/5 (33)
Graph 22-3 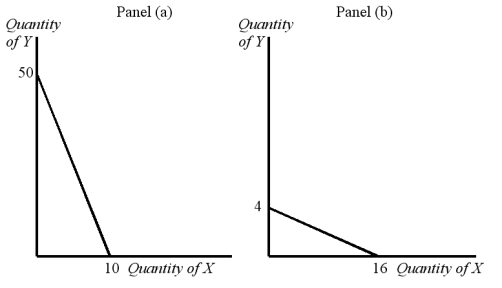 -Refer to Graph 22-3.Using the figure in panel (a), if income is equal to $160, the price of good Y is:
(Multiple Choice)
4.9/5 (34)
Frida and Brent, two economists working on public policy, are discussing a compensation scheme to accompany the introduction of a new carbon tax.The scheme compensates households by giving them just enough money to put them back on the same indifference curve they were on before the introduction of the tax."This compensation scheme is pointless," proclaims Brent."If we put consumers back on the same indifference curve, they will purchase the same bundle of goods they did before and we won't achieve any reduction in carbon emissions."
"Nah, you're so wrong," argues Frida, "what matters is the relative prices of the goods.As long as they are different we can still lower carbon emissions"
Is Frida or Brent correct? Explain your reasoning.
(Essay)
4.9/5 (37)
A consumer always prefers to be on a higher indifference curve to a lower indifference curve.
(True/False)
4.8/5 (41)
Filters
- Essay(0)
- Multiple Choice(0)
- Short Answer(0)
- True False(0)
- Matching(0)