Exam 5: Elasticity and Its Application
Exam 1: Ten Lessons From Economics146 Questions
Exam 2: Thinking Like an Economist133 Questions
Exam 3: Interdependence and the Gains From Trade139 Questions
Exam 4: The Market Forces of Supply and Demand215 Questions
Exam 5: Elasticity and Its Application178 Questions
Exam 6: Supply, Demand and Government Policies145 Questions
Exam 7: Consumers, Producers and the Efficiency of Markets171 Questions
Exam 8: Application: the Costs of Taxation135 Questions
Exam 9: Application: International Trade151 Questions
Exam 10: Externalities199 Questions
Exam 11: Public Goods and Common Resources178 Questions
Exam 12: The Design of the Tax System154 Questions
Exam 13: The Costs of Production191 Questions
Exam 14: Firms in Competitive Markets198 Questions
Exam 15: Monopoly212 Questions
Exam 16: Monopolistic Competition212 Questions
Exam 17: Business Strategy and Oligopoly179 Questions
Exam 18: Competition Policy103 Questions
Exam 19: The Markets for the Factors of Production214 Questions
Exam 20: Earnings, Unions and Discrimination201 Questions
Exam 21: Income Inequity and Poverty111 Questions
Exam 22: The Theory of Consumer Choice158 Questions
Exam 23: Frontiers of Microeconomics111 Questions
Exam 24: Measuring a Nations Income51 Questions
Exam 25: Measuring the Cost of Living55 Questions
Exam 26: Production and Growth62 Questions
Exam 27: Saving, Investment and the Financial System62 Questions
Exam 28: The Natural Rate of Unemployment58 Questions
Exam 29: The Monetary System66 Questions
Exam 30: Inflation: Its Causes and Costs74 Questions
Exam 31: Open-Economy Macroeconomics: Basic Concepts68 Questions
Exam 32: A Macroeconomic Theory of the Open Economy61 Questions
Exam 33: Aggregate Demand and Aggregate Supply81 Questions
Exam 34: The Influence of Monetary and Fiscal Policy on Aggregate Demand73 Questions
Exam 35: The Short-Run Trade-Off Between Inflation and Unemployment57 Questions
Exam 36: Global Financial Crisis of 2008 and Beyond37 Questions
Exam 37: Five Debates Over Macroeconomic Policy38 Questions
Select questions type
Use the graphs below to answer the following questions. 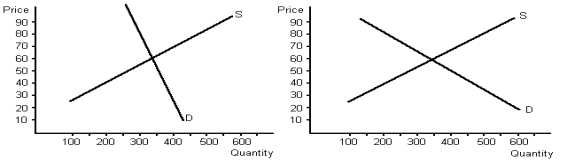 a.Determine equilibrium price and quantity for each graph.
b.Given demand and supply, what would total revenue be for each graph?
c.Assume that supply shifts to the left on both graphs by 100, raising price.Given the new equilibrium price and equilibrium quantity, what would total revenue be for each graph?
d.What do your answers to part c tell you about the relationship between elasticity of demand and total revenue?
a.Determine equilibrium price and quantity for each graph.
b.Given demand and supply, what would total revenue be for each graph?
c.Assume that supply shifts to the left on both graphs by 100, raising price.Given the new equilibrium price and equilibrium quantity, what would total revenue be for each graph?
d.What do your answers to part c tell you about the relationship between elasticity of demand and total revenue?
Free
(Essay)
4.9/5  (30)
(30)
Correct Answer: Verified
a.The equilibrium price would be $60 and the equilibrium quantity would be 350.b.Total revenue for both graphs would be $21 000 ($60 × 350).c.On graph A, equilibrium price is now $72 and equilibrium quantity is 325.Total revenue for graph A would now be $23 400.On graph B, equilibrium price is now $65 and equilibrium quantity is now 300.Total revenue for graph B would now be $19 500.(See the graphs for this answer.)
d.The answer to C shows the expected outcome.Since the demand curve in graph A is inelastic, we would expect that when price increased, total revenue would increase (from $21 000 to $23 400).On graph B, since the demand is elastic, we would expect an increase in price to lower total revenue (from $21 000 to $19 500).
The main reason for using the midpoint method is that it:
Free
(Multiple Choice)
4.8/5 (31)
Correct Answer:Verified
A
Food and clothing tend to have:
Free
(Multiple Choice)
4.9/5 (38)
Correct Answer:Verified
A
The price of a hamburger increases by 25 per cent and the quantity of hamburgers demanded per week falls by 50 per cent.The price elasticity of demand is two.
(True/False)
4.8/5 (40)
If the quantity supplied responds only slightly to changes in price, then:
(Multiple Choice)
4.9/5 (36)
Suppose a coffee plantation in Colombia increases the quantity of coffee beans it supplies by 5% when it learns that the price of a coffee at cafes in Melbourne has risen by 25%.The Colombian producer's price elasticity of supply of coffee beans is 0.2.
(True/False)
4.8/5 (30)
If the measured elasticity is less than one it means that the demand for this good is inelastic.
(True/False)
4.9/5 (35)
The cross-price elasticity of demand will be positive for complement goods and negative for substitute goods.
(True/False)
4.8/5 (35)
If the price elasticity of demand is 1.5, a price decrease will cause total revenue to increase.
(True/False)
4.8/5 (40)
Suppose the price of product X is increased from $8.00 to $10.00 and as a result, the quantity of X demanded decreases from 1500 to 1000.Using the midpoint method, the price elasticity of demand for X in the given price range is:
(Multiple Choice)
4.9/5 (42)
If a good is a necessity, demand for the good would tend to be:
(Multiple Choice)
4.8/5 (44)
If for a given price, the supply curve becomes flatter, the elasticity of supply at this point will:
(Multiple Choice)
4.8/5 (37)
The local pizza restaurant makes such great bread sticks that consumers do not respond much to a change in the price.If the owner is only interested in increasing revenue, he should:
(Multiple Choice)
4.9/5 (32)
Sketch three demand curves.Curve A should be perfectly elastic, curve B should be perfectly inelastic and curve C should be unit elastic.
(Essay)
4.8/5 (31)
If a change in the price of a good results in no change in total revenue:
(Multiple Choice)
4.7/5 (34)
Graph 5-1 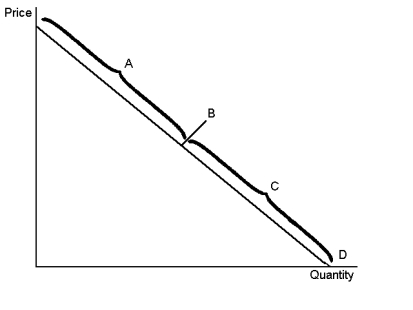 -In Graph 5-1, the section of the demand curve labelled C represents the:
(Multiple Choice)
4.8/5 (29)
Filters
- Essay(0)
- Multiple Choice(0)
- Short Answer(0)
- True False(0)
- Matching(0)