Essay
Use the graphs below to answer the following questions. 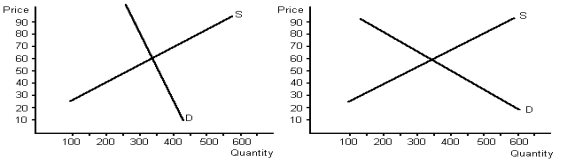
a.Determine equilibrium price and quantity for each graph.
b.Given demand and supply, what would total revenue be for each graph?
c.Assume that supply shifts to the left on both graphs by 100, raising price.Given the new equilibrium price and equilibrium quantity, what would total revenue be for each graph?
d.What do your answers to part c tell you about the relationship between elasticity of demand and total revenue?
Correct Answer:

Verified
Correct Answer:
Verified
Q2: The main reason for using the midpoint
Q3: Food and clothing tend to have:<br>A)small income
Q4: The price of a hamburger increases by
Q5: A vertical supply curve signifies that:<br>A)a change
Q6: If the quantity supplied responds only slightly
Q7: Suppose a coffee plantation in Colombia increases
Q8: If the measured elasticity is less than
Q10: The cross-price elasticity of demand will be
Q11: If the price elasticity of demand is
Q80: Income elasticity of demand measures how<br>A)the quantity