Exam 9: Correlation and Regression
Exam 1: Introduction to Statistics74 Questions
Exam 2: Descriptive Statistics165 Questions
Exam 3: Probability125 Questions
Exam 4: Discrete Probability Distributions103 Questions
Exam 5: Normal Probability Distributions158 Questions
Exam 6: Confidence Intervals97 Questions
Exam 7: Hypothesis Testing With One Sample159 Questions
Exam 8: Hypothesis Testing With Two Samples122 Questions
Exam 9: Correlation and Regression118 Questions
Exam 10: Chi-Square Tests and the F-Distribution91 Questions
Exam 11: Nonparametric Tests Online and CD Only81 Questions
Select questions type
A medical researcher wishes to see whether there is a relationship between a personʹs age, cholesterol level,
and systolic blood pressure. Eight people are randomly selected. The data are listed below. Person Age Cholesterol level Blood Pressure 1 38 220 116 2 41 225 120 3 45 200 123 4 48 190 131 5 51 250 142 6 53 215 145 7 57 200 148 8 61 170 150 a)Find a multiple regression equation for the data.
b)What is the standard error of estimate?
c)What is the coefficient of determination?
d)Interpret the results in (c).
e)If a person 50 years old with a cholesterol reading of 220 is selected, what is that personʹs predicted blood
pressure reading?
Free
(Essay)
4.9/5  (34)
(34)
Correct Answer: Verified
a)ŷ = b) = 2.02
c) = 0.984.
d)The multiple regression equation explains 98.4% of the variation in y.
e)136
In order for applicants to work for the foreign-service department, they must take a test in the language of the country where they plan to work. The data below shows the relationship between the number of years that
Applicants have studied a particular language and the grades they received on the proficiency exam. Construct
A 95% prediction interval for y given x = 2.5, = 6.91x + 46.26, and = 4.578. Round interval to two decimal
Places. Number of years, x 3 4 4 5 3 6 2 7 3 Grades on test, y 61 68 75 82 73 90 58 93 72
Free
(Multiple Choice)
4.7/5 (38)
Correct Answer:Verified
A
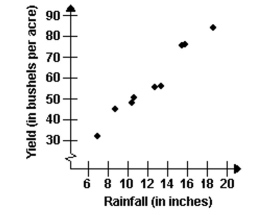
In an area of the Midwest, records were kept on the relationship between the rainfall (in inches)and the yield
of wheat (bushels per acre). Construct a scatter plot for the data. Rain fall (in inches), 10.5 8.8 13.4 12.5 18.8 10.3 7.0 15.6 16.0 Yield (bushels per acre), y 50.5 46.2 58.8 59.0 82.4 49.2 31.9 76.0 78.8
Free
(Essay)
4.9/5 (43)
Correct Answer:Verified
A manager wishes to determine the relationship between the number of miles (in hundreds of miles)the
managerʹs sales representatives travel per month and the amount of sales (in thousands of dollars)per month.
Test the significance of the correlation coefficient using α = 0.01 and the claim ρ Miles traveled, x 5 6 13 10 11 18 6 4 14 Sales, y 33 35 80 64 67 63 50 57 122
(Essay)
4.9/5 (39)
The data below are the final exam scores of 10 randomly selected statistics students and the number of hours they studied for the exam. Calculate the correlation coefficient r. Hours, 2 4 1 7 1 3 3 4 5 2 Scores, y 68 83 63 91 69 81 88 93 93 74
(Multiple Choice)
4.9/5 (40)
Given the equation of a regression line is y = -1.04x + 50.3, determine whether there is a positive linear correlation or a negative linear correlation.
(Multiple Choice)
4.7/5 (32)
Calculate the coefficient of correlation, r, letting Row 1 represent the x-values and Row 2 represent the
y-values. Now calculate the coefficient of correlation, r, letting Row 2 represent the x-values and Row 1
represent the y-values. What effect does switching the explanatory and response variables have on the
correlation coefficient? Row 1 1 3 10 7 5 4 6 8 9 2 Row 2 -7 11 12 4 1 -3 2 6 9 11
(Short Answer)
4.8/5 (40)
A medical researcher wishes to see whether there is a relationship between a personʹs age, cholesterol level,
and systolic blood pressure. Eight people are randomly selected. The data are listed below. Person Age Cholesterol level Blood Pressure 1 38 220 116 2 41 225 120 3 45 200 123 4 48 190 131 5 51 250 142 6 53 215 145 7 57 200 148 8 61 170 150 Calculate the adjusted coefficient of determination,
(Short Answer)
4.8/5 (39)
A researcher at a local law university wishes to see whether a studentʹs grade point average and age are related
to a studentʹs score on the state bar exam. Six students are randomly selected. The data are given below. Student GPA Age Score 1 3.5 23 530 2 2.8 28 550 3 3.9 22 690 4 3.4 27 620 5 2.3 21 430 6 3.3 26 580 Calculate the adjusted coefficient of determination,
(Short Answer)
4.8/5 (43)
A researcher at a local law university wishes to see whether a studentʹs grade point average and age are related
to a studentʹs score on the state bar exam. Six students are randomly selected. The data are given below. Student GPA Age Score 1 3.5 23 530 2 2.8 28 550 3 3.9 22 690 4 3.4 27 620 5 2.3 21 430 6 3.3 26 580 a)Find a multiple regression equation for the data.
b)What is the standard error of estimate?
c)What is the coefficient of determination?
d)Interpret the results in (c).
e)Predict the state bar exam score for a 25-year-old student with a grade point average of 3.0.
(Essay)
4.9/5 (30)
The data below are the final exam scores of 10 randomly selected statistics students and the number of hours they studied for the exam. Find the equation of the regression line for the given data. Hours, 3 5 2 8 2 4 4 5 6 3 Scores, 65 80 60 88 66 78 85 90 90 71
(Multiple Choice)
4.7/5 (33)
Construct a 95% prediction interval for y given x = -3.5, ? = 2.097x - 0.552 and = 0.976. Round interval to two decimal places. -5 -3 4 1 -1 -2 0 2 3 -4 -10 -8 9 1 -2 -6 -1 3 6 -8
(Multiple Choice)
4.8/5 (34)
The data below are the temperatures on randomly chosen days during a summer class and the number of
absences on those days. Construct a scatter plot for the data. Temperature, 72 85 91 90 88 98 75 100 80 Number of absences, 3 7 10 10 8 15 4 15 5
(Essay)
4.8/5 (27)
In an area of the Midwest, records were kept on the relationship between the rainfall (in inches)and the yield
of wheat (bushels per acre). Test the significance of the correlation coefficient using α = 0.01 and the claim ρ Rain fall (in inches), x 11 9.3 13.9 13 19.3 10.8 7.5 16.1 16.5 Yield (bushels per acre), y 51.5 47.2 59.8 60 83.4 50.2 32.9 77 79.8
(Essay)
4.9/5 (33)
The data below are the gestation periods, in months, of randomly selected animals and their corresponding life
spans, in years. Construct a scatter plot for the data. Determine whether there is a positive linear correlation, a
negative linear correlation, or no linear correlation. Gestation, 8 2.1 1.3 1 11.5 5.3 3.8 24.3 Life span, 30 12 6 3 25 12 10 40
(Essay)
4.8/5 (38)
Given a sample with r = -0.541, n = 20, test the significance of the correlation r using α = 0.01 and the claim ρ = 0.
(Essay)
4.9/5 (38)
A manager wishes to determine the relationship between the number of miles (in hundreds of miles)the manager?s sales representatives travel per month and the amount of sales (in thousands of dollars)per month.
Find the equation of the regression line for the given data. Miles traveled, 2 3 10 7 8 15 3 1 11 Sales, 31 33 78 62 65 61 48 55 120
(Multiple Choice)
4.9/5 (40)
Find the equation of the regression line by letting Row 1 represent the x-values and Row 2 represent the
y-values. Now find the equation of the regression line letting Row 2 represent the x-values and Row 1
represent the y-values. What effect does switching the explanatory and response variables have on the
regression line? Row 1 -5 -3 4 1 -1 -2 0 2 3 -4 Row 2 -10 -8 9 1 -2 -6 -1 3 6 -8
(Essay)
4.9/5 (28)
Find the standard error of estimate, for the data below, given that y = 2.097x - 0.552. -5 -3 4 1 -1 -2 0 2 3 -4 -10 -8 9 1 -2 -6 -1 3 6 -8
(Multiple Choice)
4.9/5 (30)
The data below are the temperatures on randomly chosen days during a summer class and the number of absences on those days. Calculate the correlation coefficient, r. Temperature, 76 89 95 94 92 102 79 104 84 Number of absences, y 12 16 19 19 17 24 13 24 14
(Multiple Choice)
4.8/5 (37)
Filters
- Essay(0)
- Multiple Choice(0)
- Short Answer(0)
- True False(0)
- Matching(0)