Exam 8: Hypothesis Testing With Two Samples
Exam 1: Introduction to Statistics74 Questions
Exam 2: Descriptive Statistics165 Questions
Exam 3: Probability125 Questions
Exam 4: Discrete Probability Distributions103 Questions
Exam 5: Normal Probability Distributions158 Questions
Exam 6: Confidence Intervals97 Questions
Exam 7: Hypothesis Testing With One Sample159 Questions
Exam 8: Hypothesis Testing With Two Samples122 Questions
Exam 9: Correlation and Regression118 Questions
Exam 10: Chi-Square Tests and the F-Distribution91 Questions
Exam 11: Nonparametric Tests Online and CD Only81 Questions
Select questions type
Suppose you want to test the claim that TTwo samples are random, independent, and come from populations that are normally distributed. The sample statistics are given below. Assume that At a
Level of significance of α = 0.20, when should you reject H₀? =11 =18 =2.9 =3.3 =0.76 =0.51
(Multiple Choice)
4.9/5  (39)
(39)
As part of a marketing experiment, a department store regularly mailed discount coupons to 25 of its credit card holders. Their total credit card purchases over the next three months were compared to their prior credit
Card purchases during the previous three months. Determine whether the samples are dependent or
Independent.
(Multiple Choice)
4.9/5 (44)
A weight-lifting coach claims that weight-lifters can increase their strength by taking a certain supplement. To
test the theory, the coach randomly selects 9 athletes and gives them a strength test using a bench press. The
results are listed below. Thirty days later, after regular training using the supplement, they are tested again.
The new results are listed below. Test the claim that the supplement is effective in increasing the athletesʹ
strength. Assume the samples are random and dependent, and the populations are normally distributed. Use = 0.05. Athlete 1 2 3 4 5 6 7 8 9 Before 215 240 188 212 275 260 225 200 185 After 225 245 188 210 282 275 230 195 190
(Essay)
4.8/5 (36)
A local bank claims that the waiting time for its customers to be served is the lowest in the area. A competitor
bank checks the waiting times at both banks. Use P-values to test the local bankʹs claim. Use = 0.05. Assume
the two samples are random and independent. Local Bank Competitor Bank =45 =50 1=5.3 minutes 2=5.6 minutes =1.1 minutes =1.0 minutes
(Essay)
4.8/5 (35)
A youth prevention organization is examining the effect of peer pressure on the decision of teenagers to smoke.
A survey of 97 teenagers, ages 11 to 17 years who smoked in the last 30 days, was conducted. The random
sample consisted of 25 teenagers who said all/most of their friends smoke, 40 who said some of their friends
smoke, and 32 who said none of their friends smoke. The results are shown in the figure. At α = 0.01, can you
support the organizationʹs claim that the proportion of teens who decide to smoke is lower when none of their
friends smoke? How Friends Affect Youth Smoking
Percentage of 11-17-year-olds who smoked a cigarette at least once in the past 30 days.
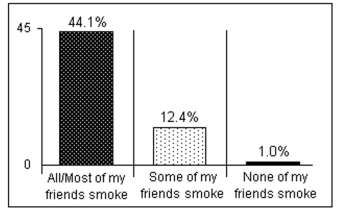 Source: Philip Morris USA Youth Smoking Prevention. Teenage Attitudes and Behavior Study. 2002.
(Essay)
4.9/5 (33)
Find the standardized test statistic, z, to test the claim that Assume the samples are random and independent.
Sample statistics:
(Multiple Choice)
4.9/5 (40)
Find the standardized test statistic, t, to test the claim that Two samples are random, independent, and come from populations that are normally distributed. The sample statistics are given below. Assume that =15 =15 1=21.2 2=23.75 =2.9 =2.8
(Multiple Choice)
4.9/5 (35)
Two samples are random and independent. Find the P-value used to test the claim that Population statistics: Sample statisticsstatistics:
(Multiple Choice)
4.7/5 (36)
In a recent survey of gun control laws, a random sample of 1000 women showed that 65% were in favor of stricter gun control laws. In a random sample of 1000 men, 60% favored stricter gun control laws. Construct a
95% confidence interval for
(Multiple Choice)
4.8/5 (34)
Find the standardized test statistic, t, to test the claim that Two samples are random, independent, and come from populations that are normally distributed. The sample statistics are given below. Assume that =14 =12 =14 =15 =2.5 =2.8
(Multiple Choice)
5.0/5 (40)
As part of a Masterʹs thesis project, a mathematics teacher is interested in the effects of two different teaching methods on mathematics achievement. She randomly chooses a class of students to learn one algebraic concept
Using traditional methods. Then on another day, the same students learn a similar algebraic concept using
Manipulatives. The teacher then compares their test scores. Determine whether the samples are dependent or
Independent.
(Multiple Choice)
4.7/5 (36)
Find the standardized test statistic, t, to test the claim that Two samples are random, independent, and come from populations that are normally distributed. The sample statistics are given below. Assume that =18 =13 1=515 =500 =40 =25
(Multiple Choice)
4.9/5 (36)
Construct a 95% confidence interval for Two samples are random, independent, and come from populations that are normally distributed. The sample statistics are given below. Assume that =8 =7 1=4.1 2=5.5 =0.76 =2.51
(Multiple Choice)
4.9/5 (44)
Suppose you want to test the claim that Assume the two samples are random and independent. At a level of significance of α = 0.05, when should you reject H₀?
Population statistics: Sample statistics:
(Multiple Choice)
4.7/5 (40)
Find the critical values, to test the claim that Two samples are random, independent, and come from populations that are normal. The sample statistics are given below. Assume that Use = 0.05. =14 =12 1=15 2=16 =2.5 =2.8
(Multiple Choice)
4.9/5 (33)
A well-known study of 22,000 randomly selected male physicians was conducted to determine if taking aspirin
daily reduces the chances of a heart attack. Half of the physicians were given a regular dose of aspirin while the
other half was given placebos. Six years later, among those who took aspirin, 104 suffered heart attacks while
among those who took placebos, 189 suffered heart attacks. Does it appear that the aspirin can reduce the
number of heart attacks among the sample group that took aspirin? Use
(Essay)
4.7/5 (30)
Suppose you want to test the claim that Two samples are random, independent, and come from populations that are normally distributed. The sample statistics are given below. Assume that At a
Level of significance of α = 0.01, when should you reject H₀? =18 =13 =595 =580 1=40 2=25
(Multiple Choice)
4.8/5 (35)
A financial advisor wants to know whether there is a significant difference between the NYSE and NASDAQ
markets in the annual dividend rates for preferred stocks. A sample of 30 returns is selected from each market.
Assume the two samples are random and independent. Test the claim that there is no difference in the annual
dividend rates for the two markets. Use = 0.05. NASDAQ 2.00 1.02 2.11 2.56 2.15 0.93 0.91 1.67 1.88 2.13 2.44 1.97 2.00 1.81 2.25 1.72 1.75 1.05 0.90 2.34 0.51 1.00 2.25 0.85 1.50 2.33 1.59 2.25 0.23 1.63 NYSE 1.46 3.00 1.74 5.19 1.69 1.88 2.85 2.00 2.19 2.03 1.81 5.00 1.72 3.38 2.09 4.50 3.07 1.97 1.78 1.50 1.97 4.65 3.12 2.19 2.19 3.50 1.56 4.10 3.00 4.40
(Essay)
4.7/5 (20)
A nutritionist believes that obesity is more prevalent among American adults than it was in the past. He
discovers that in a study conducted in the year 1994, 380 of the 1630 randomly chosen adults were classified as
obese. However, in a more recent study, he finds 726 out of 2350 randomly chosen adults were classified as
obese. Construct a 95% confidence interval for the difference in proportions
(Essay)
4.7/5 (40)
A local bank claims that the waiting time for its customers to be served is the lowest in the area. A competitor
bank checks the waiting times at both banks. Test the local bankʹs claim using α = 0.05. Assume the two
samples are random and independent.
Local Bank Competitor Bank =45 =50 1=5.6 minutes 2=5.9 minutes =1.1 minutes =1.0 minute
(Essay)
4.7/5 (39)
Filters
- Essay(0)
- Multiple Choice(0)
- Short Answer(0)
- True False(0)
- Matching(0)