Exam 11: Probability and Calculus
Exam 1: Functions and Graphs224 Questions
Exam 2: Limits and the Derivative123 Questions
Exam 3: Additional Derivative Topics126 Questions
Exam 4: Graphing and Optimization116 Questions
Exam 5: Integration93 Questions
Exam 6: Additional Integration Topics82 Questions
Exam 7: Multivariable Calculus78 Questions
Exam 8: Trigonometric Functions92 Questions
Exam 9: Differential Equations47 Questions
Exam 10: Taylor Polynomials and Infinite Series48 Questions
Exam 11: Probability and Calculus57 Questions
Exam 12: Basic Algebra Review44 Questions
Exam 13: Special Topics20 Questions
Select questions type
Given a normal distribution with mean 40 and standard deviation 8, find the number of standard deviations the
measurement is from the mean. Express the answer as a positive number.
-50
(Multiple Choice)
4.8/5  (40)
(40)
Given a normal distribution with mean -10 and standard deviation 5, find the area under the normal curve and above the
given interval on the horizontal axis.
-(-∞ , -5]
(Multiple Choice)
4.8/5 (37)
Given a normal distribution with mean 150 and standard deviation 25, find the indicated probability.
-
(Multiple Choice)
4.9/5 (33)
Find a constant k so that kf is a probability density function, or state it does not exist.
-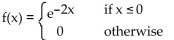
(Multiple Choice)
4.9/5 (36)
Solve the problem.
-Computer experts warn that writable compact disks such as CD-Rs (Compact Disc-Recordable) and CD-RWs
(Compact Disc-ReWriteable) have much shorter lifespans than other digital storage methods such as hard
drives or magnetic tape. The time until the disc becomes unreadable for a particular brand of CD-RWs is a
continuous random variable with probability density function given by the following function. Round to two decimal
places. 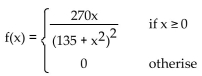 (A) What is the probability that a disc is not readable after 25 years?
(B) What is the probability that the disc is readable after 10 years?
(C) If the user wants the probability that the disc is readable to be 0.9, when is the last time it should be read?
(A) What is the probability that a disc is not readable after 25 years?
(B) What is the probability that the disc is readable after 10 years?
(C) If the user wants the probability that the disc is readable to be 0.9, when is the last time it should be read?
(Short Answer)
4.9/5 (33)
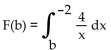
Find F(b), use a graphing calculator to graph F  and use the graph to estimate
  -
-
(Multiple Choice)
4.7/5 (49)
Given a normal distribution with mean 40 and standard deviation 8, find the number of standard deviations the
measurement is from the mean. Express the answer as a positive number.
-24
(Multiple Choice)
4.8/5 (37)
Use a graphing calculator to approximate the median of the indicated probability density function f. Round to two
decimal places.
-
(Multiple Choice)
4.9/5 (36)
Solve the problem.
-Find the area under the standard normal curve from 0 to the indicated value of z. 0.85
(Multiple Choice)
4.8/5 (47)
Find the associated cumulative distribution function. Graph both functions (on separate sets of axes).
-
(Essay)
4.8/5 (36)
Solve the problem.
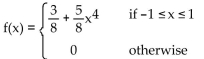
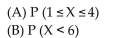
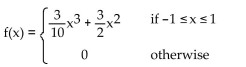
-Use the given function to find the indicated probabilities. Illustrate each probability with a graph. 
(Essay)
4.8/5 (33)
Solve the problem.
-Find and graph the cumulative distribution function associated with the function. 
(Essay)
4.9/5 (34)
Solve the problem.
-Use the given function to find the indicated probabilities. Illustrate each probability with a graph. 

(Essay)
4.8/5 (36)
Find the associated cumulative distribution function. Graph both functions (on separate sets of axes).
-
(Essay)
4.7/5 (48)
Solve the problem.
-The perpetual annual rent for a property is $35,000. Find the capital value at 4% compounded continuously.
(Multiple Choice)
4.8/5 (36)
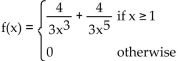
Find the probability density function f and the associated cumulative distribution function F for the continuous random
variable X if
-X is an exponential random variable with 
(Multiple Choice)
4.8/5 (41)
Filters
- Essay(0)
- Multiple Choice(0)
- Short Answer(0)
- True False(0)
- Matching(0)