Exam 27: The Phillips Curve and Expectations Theory
Exam 1: Introducing the Economic Way of Thinking85 Questions
Exam 2: Production Possibilities Opportunity Cost and Economic Growth107 Questions
Exam 3: Market Demand and Supply176 Questions
Exam 4: Markets in Action137 Questions
Exam 5: Price Elasticity of Demand and Supply151 Questions
Exam 6: Consumer Choice Theory96 Questions
Exam 7: Production Costs131 Questions
Exam 8: Perfect Competition126 Questions
Exam 9: Monopoly81 Questions
Exam 10: Monopolistic Competition and Oligopoly97 Questions
Exam 11: Labor Markets105 Questions
Exam 12: Income Distribution Poverty and Discrimination57 Questions
Exam 13: Antitrust and Regulation96 Questions
Exam 14: Environmental Economics47 Questions
Exam 15: Gross Domestic Product109 Questions
Exam 16: Business Cycles and Unemployment94 Questions
Exam 17: Inflation56 Questions
Exam 18: The Keynesian Model111 Questions
Exam 19: The Keynesian Model in Action105 Questions
Exam 20: Aggregate Demand and Supply94 Questions
Exam 21: Fiscal Policy108 Questions
Exam 22: The Public Sector55 Questions
Exam 23: Federal Deficits Surpluses and the National Debt42 Questions
Exam 24: Money and the Federal Reserve System75 Questions
Exam 25: Money Creation117 Questions
Exam 26: Monetary Policy106 Questions
Exam 27: The Phillips Curve and Expectations Theory59 Questions
Exam 28: International Trade and Finance127 Questions
Exam 29: Economies in Transition46 Questions
Exam 30: Growth and the Less Developed Countries55 Questions
Exam 31: Understanding Direct and Inverse Relationships between Variables172 Questions
Select questions type
Under the natural rate hypothesis, expansionary monetary and fiscal policies can at best produce a:
(Multiple Choice)
4.9/5  (33)
(33)
According to rational expectations theory, predictable expansionary monetary and fiscal policies to reduce the unemployment rate are:
(Multiple Choice)
4.7/5 (35)
What is the difference between the Keynesian and rational expectations theories concerning the success of stabilization policy?
(Essay)
4.9/5 (34)
Exhibit 17-2 Aggregate demand and aggregate supply curves
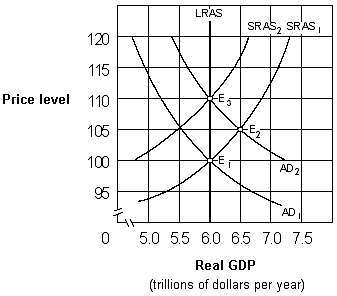 As shown in Exhibit 17-2, if people behave according to adaptive expectations theory, an increase in the aggregate demand curve from AD1 to AD2 will cause:
(Multiple Choice)
4.8/5 (28)
If the government accelerates money supply growth and enlarges the budget deficit to stimulate aggregate demand, the rational expectations hypothesis indicates that decision makers will:
(Multiple Choice)
4.9/5 (40)
"Preannounced, stable policies to achieve a low and constant money supply growth and a balanced federal budget are therefore the best way to lower the inflation rate." This statement best illustrates the:
(Multiple Choice)
4.7/5 (35)
Exhibit 17-2 Aggregate demand and aggregate supply curves
 As shown in Exhibit 17-2, if people behave according to adaptive expectations theory, an increase in the aggregate demand curve from AD1 to AD2 will cause the price level to move:
(Multiple Choice)
4.8/5 (37)
On a Phillips curve diagram, a decrease in the rate of inflation, other things being equal, is represented by a(n):
(Multiple Choice)
4.9/5 (40)
Exhibit 17-2 Aggregate demand and aggregate supply curves
 As shown in Exhibit 17-2, if people behave according to rational expectations theory, an increase in the aggregate demand curve from AD1 to AD2 will cause the economy to move:
(Multiple Choice)
4.7/5 (31)
Exhibit 17-5 Short-run and long-run Phillips curve
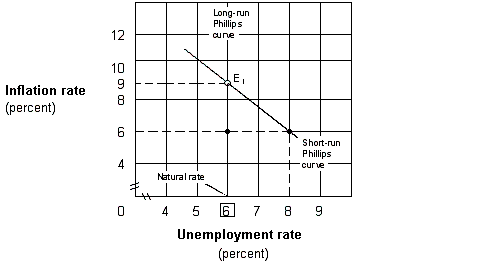 Suppose the government shown in Exhibit 17-5 uses contractionary monetary policy to reduce inflation from 9 to 6 percent. If people have rational expectations, then:
(Multiple Choice)
4.8/5 (29)
Wage and price controls imposed for an extended period of time are likely to result in:
(Multiple Choice)
4.7/5 (46)
Which of the following groups believes that government policy is undermined by people's incorporation of the anticipated consequences of the policy into their present decisions?
(Multiple Choice)
4.8/5 (38)
Under adaptive expectations theory, a decrease in the short-run aggregate demand curve ____ the inflation rate and ____ the unemployment rate.
(Multiple Choice)
4.9/5 (31)
According to the Phillips curve, a more expansionary macro-policy that causes inflation to be greater will:
(Multiple Choice)
4.8/5 (36)
Exhibit 17-1 Inflation and unemployment rates
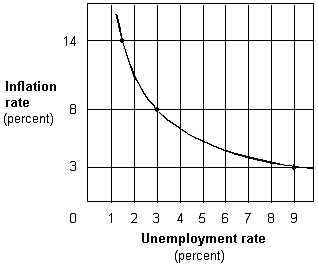 In Exhibit 17-1, when the unemployment rate goes from 3 percent to 9 percent,
(Multiple Choice)
4.9/5 (32)
When people use recent information to gradually adjust their forecasts of inflation, they are said to have:
(Multiple Choice)
4.9/5 (40)
Filters
- Essay(0)
- Multiple Choice(0)
- Short Answer(0)
- True False(0)
- Matching(0)