Exam 31: Understanding Direct and Inverse Relationships between Variables
Exam 1: Introducing the Economic Way of Thinking85 Questions
Exam 2: Production Possibilities Opportunity Cost and Economic Growth107 Questions
Exam 3: Market Demand and Supply176 Questions
Exam 4: Markets in Action137 Questions
Exam 5: Price Elasticity of Demand and Supply151 Questions
Exam 6: Consumer Choice Theory96 Questions
Exam 7: Production Costs131 Questions
Exam 8: Perfect Competition126 Questions
Exam 9: Monopoly81 Questions
Exam 10: Monopolistic Competition and Oligopoly97 Questions
Exam 11: Labor Markets105 Questions
Exam 12: Income Distribution Poverty and Discrimination57 Questions
Exam 13: Antitrust and Regulation96 Questions
Exam 14: Environmental Economics47 Questions
Exam 15: Gross Domestic Product109 Questions
Exam 16: Business Cycles and Unemployment94 Questions
Exam 17: Inflation56 Questions
Exam 18: The Keynesian Model111 Questions
Exam 19: The Keynesian Model in Action105 Questions
Exam 20: Aggregate Demand and Supply94 Questions
Exam 21: Fiscal Policy108 Questions
Exam 22: The Public Sector55 Questions
Exam 23: Federal Deficits Surpluses and the National Debt42 Questions
Exam 24: Money and the Federal Reserve System75 Questions
Exam 25: Money Creation117 Questions
Exam 26: Monetary Policy106 Questions
Exam 27: The Phillips Curve and Expectations Theory59 Questions
Exam 28: International Trade and Finance127 Questions
Exam 29: Economies in Transition46 Questions
Exam 30: Growth and the Less Developed Countries55 Questions
Exam 31: Understanding Direct and Inverse Relationships between Variables172 Questions
Select questions type
Using supply and demand curve analysis, the triangular area below the equilibrium price and above the supply curve is:
Free
(Multiple Choice)
4.8/5  (34)
(34)
Correct Answer: Verified
B
At the unique point of consumer equilibrium, the:
Free
(Multiple Choice)
4.8/5 (46)
Correct Answer:Verified
D
Suppose seller X is willing to sell one good X for $5, a second good X for $10, a third for $16, a fourth for $25, and the market price is $20. What is seller X's producer surplus?
Free
(Multiple Choice)
4.7/5 (34)
Correct Answer:Verified
D
Exhibit 6A-2 Consumer Equilibrium
 Given the budget lines and indifference curves shown in Exhibit 6A-2, point B yields:
(Multiple Choice)
4.7/5 (40)
Exhibit 3A-2 Comparison of Market Efficiency and Deadweight Loss
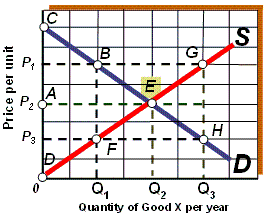 As shown in Exhibit 3A-2, if the quantity supplied of good X per year is Q1, the result is:
(Multiple Choice)
4.9/5 (35)
Producer surplus measures the value between the actual selling price and the:
(Multiple Choice)
4.9/5 (36)
Exhibit 10A-1 Aggregate demand and supply model
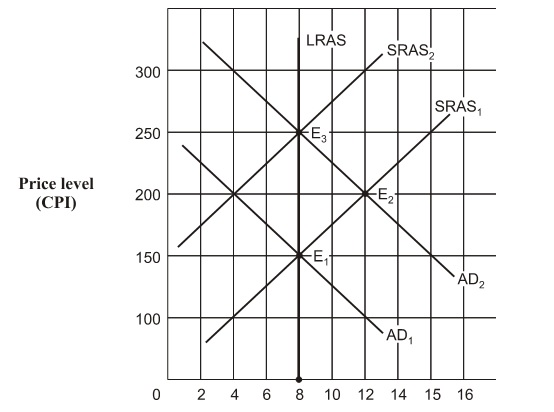 Beginning from long-run equilibrium at point E1 in Exhibit 10A-1, the aggregate demand curve shifts to AD2 . The real GDP and price level (CPI) in short-run equilibrium will be:
(Multiple Choice)
4.9/5 (40)
Exhibit 16A-2 Macro AD/AS Models
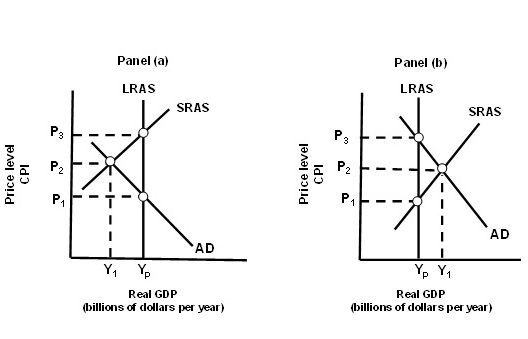 In Panel (b) of Exhibit 16A-2, the economy is initially in short-run equilibrium at real GDP level Y1 and price level P2. Classical theory argues that:
(Multiple Choice)
5.0/5 (37)
In the self-correcting AD-AS model, the economy's short-run equilibrium position is indicated by the intersection of which two curves?
(Multiple Choice)
4.8/5 (35)
If nominal wages and salaries are fixed as firms change product prices, the short-run aggregate supply curve is:
(Multiple Choice)
5.0/5 (43)
Exhibit 6A-2 Consumer Equilibrium
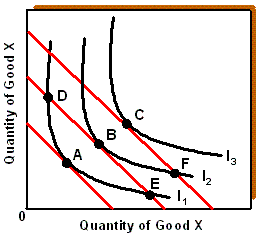 Given the budget lines and indifference curves shown in Exhibit 6A-2, points D, A, and E yield:
(Multiple Choice)
4.8/5 (34)
Exhibit 6A-3 Consumer equilibrium
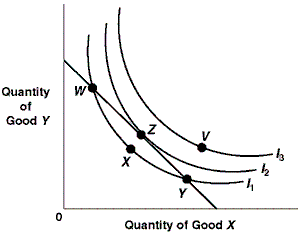 Given the budget line and indifference curves shown in Exhibit 6A-3, assume the consumer is initially at point W. To maximize total utility, the consumer should:
(Multiple Choice)
4.8/5 (32)
Exhibit 1A-4 Straight line
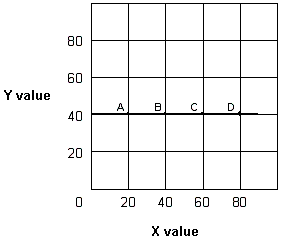 In Exhibit 1A-4, as X increases along the horizontal axis, corresponding to points A-D on the line, the Y value remains unchanged at 40 units. The relationship between the X and Y variables is:
(Multiple Choice)
4.9/5 (36)
Along the short-run aggregate supply curve (SRAS), an increase (rightward shift) in the aggregate demand curve will increase:
(Multiple Choice)
4.8/5 (38)
Distinguish a direct and an inverse relationship. Provide an example of each type of relationship.
(Essay)
4.9/5 (45)
If both the price level and nominal incomes change by the same percentage:
(Multiple Choice)
4.9/5 (25)
Filters
- Essay(0)
- Multiple Choice(0)
- Short Answer(0)
- True False(0)
- Matching(0)