Exam 1: Introducing the Economic Way of Thinking
Exam 1: Introducing the Economic Way of Thinking119 Questions
Exam 2: Production Possibilities Opportunity Cost and Economic Growth107 Questions
Exam 3: Market Demand and Supply176 Questions
Exam 4: Markets in Action136 Questions
Exam 5: Price Elasticity of Demand and Supply107 Questions
Exam 6: Production Costs123 Questions
Exam 7: Perfect Competition123 Questions
Exam 8: Monopoly80 Questions
Exam 9: Monopolistic Competition and Oligopoly82 Questions
Exam 10: Labor Markets and Income Distribution106 Questions
Exam 11: Gross Domestic Product67 Questions
Exam 12: Business Cycles and Unemployment93 Questions
Exam 13: Inflation56 Questions
Exam 14: Aggregate Demand and Supply136 Questions
Exam 15: Fiscal Policy108 Questions
Exam 16: The Public Sector55 Questions
Exam 17: Federal Deficits Surpluses and the National Debt42 Questions
Exam 18: Money and the Federal Reserve System74 Questions
Exam 19: Money Creation115 Questions
Exam 20: Monetary Policy121 Questions
Exam 21: International Trade and Finance127 Questions
Exam 22: Economies in Transition45 Questions
Exam 23: Growth and the Less Developed Countries55 Questions
Select questions type
Exhibit 1A-9 Multi-curve graph 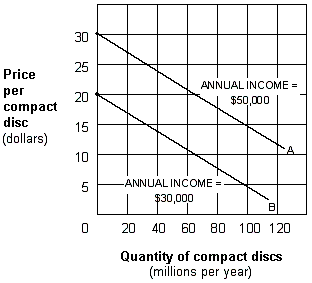 Exhibit 1A-9 represents a three-variable relationship. As the annual income of consumers falls from $50,000 (line A) to $30,000 (line B), the result is a:
(Multiple Choice)
4.9/5  (42)
(42)
The television network newscaster reports that the national inflation rate the past year equaled 4 percent. This report would be of particular interest to a
(Multiple Choice)
4.8/5 (37)
When economists want to hold a number of factors constant, they are demonstrating which of the following expressions?
(Multiple Choice)
4.7/5 (39)
Exhibit 1A-4 Straight line 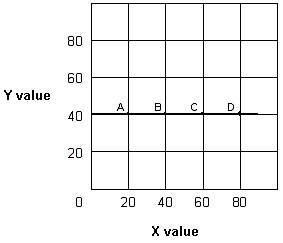 In Exhibit 1A-4, as X increases along the horizontal axis, corresponding to points A-D on the line, the Y value remains unchanged at 40 units. The relationship between the X and Y variables is:
(Multiple Choice)
4.9/5 (40)
Which of the following is the best example of a microeconomics topic?
(Multiple Choice)
4.8/5 (26)
Which of the following is the best example of a microeconomic topic?
(Multiple Choice)
4.9/5 (41)
Which of the following would an economist classify as capital?
(Multiple Choice)
4.8/5 (36)
Exhibit 1A-8 Straight line relationship  For the relationship shown in Exhibit 1A-8, suppose the price of hamburgers increases and hamburgers are a substitute for pizza. What change would occur on the graph?
(Multiple Choice)
4.9/5 (36)
Exhibit 1A-8 Straight line relationship 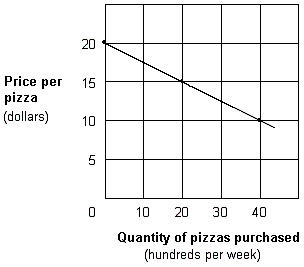 According to the Exhibit 1A-8, the relationship between the price and quantity purchased of pizza is:
(Multiple Choice)
5.0/5 (39)
Which one of the following is a positive economic statement?
(Multiple Choice)
4.9/5 (37)
Exhibit 1A-8 Straight line relationship  Which of the following would cause a shift in the relationship shown in Exhibit 1A-8?
(Multiple Choice)
4.8/5 (33)
Exhibit 1A-1 Straight line 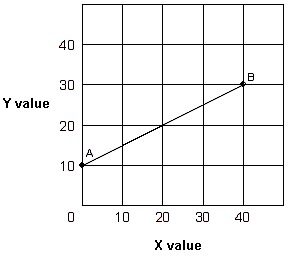 In Exhibit 1A-1, the slope of straight line AB is:
(Multiple Choice)
4.8/5 (42)
Filters
- Essay(0)
- Multiple Choice(0)
- Short Answer(0)
- True False(0)
- Matching(0)