Exam 14: Aggregate Demand and Supply
Exam 1: Introducing the Economic Way of Thinking119 Questions
Exam 2: Production Possibilities Opportunity Cost and Economic Growth107 Questions
Exam 3: Market Demand and Supply176 Questions
Exam 4: Markets in Action136 Questions
Exam 5: Price Elasticity of Demand and Supply107 Questions
Exam 6: Production Costs123 Questions
Exam 7: Perfect Competition123 Questions
Exam 8: Monopoly80 Questions
Exam 9: Monopolistic Competition and Oligopoly82 Questions
Exam 10: Labor Markets and Income Distribution106 Questions
Exam 11: Gross Domestic Product67 Questions
Exam 12: Business Cycles and Unemployment93 Questions
Exam 13: Inflation56 Questions
Exam 14: Aggregate Demand and Supply136 Questions
Exam 15: Fiscal Policy108 Questions
Exam 16: The Public Sector55 Questions
Exam 17: Federal Deficits Surpluses and the National Debt42 Questions
Exam 18: Money and the Federal Reserve System74 Questions
Exam 19: Money Creation115 Questions
Exam 20: Monetary Policy121 Questions
Exam 21: International Trade and Finance127 Questions
Exam 22: Economies in Transition45 Questions
Exam 23: Growth and the Less Developed Countries55 Questions
Select questions type
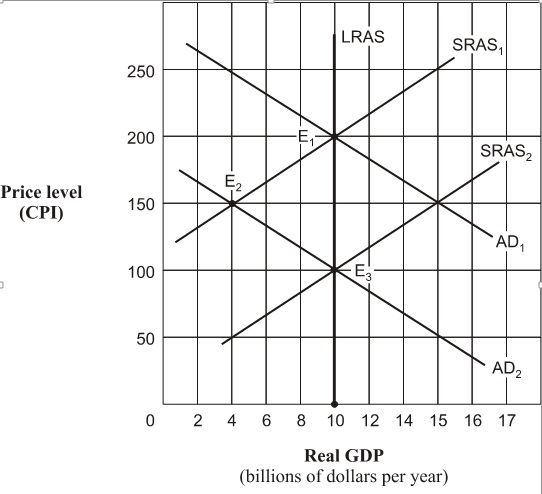
Exhibit 14-4 Aggregate supply and demand curves
 As the economy moves to the right from E1 to E2 in Exhibit 14-4 along the upward-sloping aggregate supply curve the:
(Multiple Choice)
4.8/5  (38)
(38)
Exhibit 14A-6 Aggregate demand and supply model
 Beginning from a point of short-run equilibrium at point E2 in Exhibit 14A-6, the economy's movement to a new position of long-run equilibrium from that point would best be described as:
(Multiple Choice)
4.8/5 (26)
How are demand-pull and cost-push inflation reflected in terms of the AD-AS model?
(Essay)
4.8/5 (39)
Exhibit 14-8 Aggregate demand and supply
 In Exhibit 14-8, if aggregate demand shifts from AD1 to AD2,
(Multiple Choice)
4.8/5 (33)
Exhibit 14-8 Aggregate demand and supply
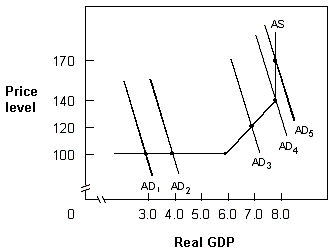 In Exhibit 14-8, when aggregate demand shifts from AD4 to AD5, the economy experiences:
(Multiple Choice)
4.8/5 (40)
The aggregate demand curve indicates the relationship between:
(Multiple Choice)
4.8/5 (39)
When the CPI is 300, a real GDP of $8 trillion is demanded in a given year. If the CPI is 250, which of the following could be the real GDP demanded?
(Multiple Choice)
4.9/5 (40)
In the horizontal segment of the aggregate supply curve, when GDP:
(Multiple Choice)
4.8/5 (26)
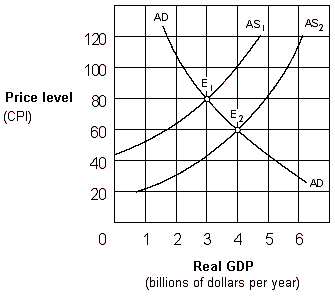
Exhibit 14A-1 Aggregate demand and supply model
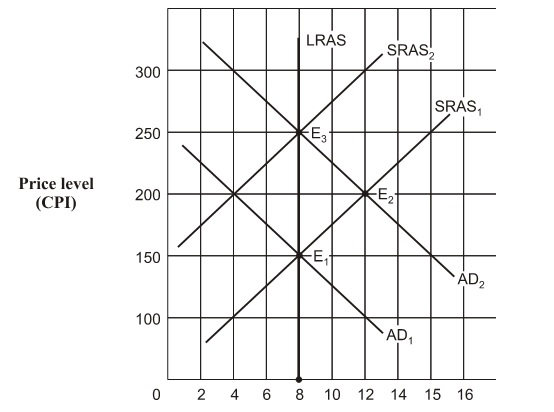 Based on Exhibit 14A-1, when the aggregate demand curve shifts to the position AD2 and the economy is operating at point E2, the economy's position of long-run equilibrium corresponds to point:
(Multiple Choice)
4.8/5 (37)
Which of the following reasons helps explain why the aggregate demand curve is downward sloping?
(Multiple Choice)
4.8/5 (49)
Exhibit 14-6 Aggregate supply curve
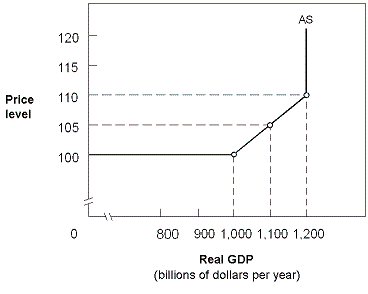 In Exhibit 14-6, where the GDP = $1,200 billion,
(Multiple Choice)
4.7/5 (40)
If both the price level and nominal incomes change by the same percentage:
(Multiple Choice)
4.7/5 (32)
Using the AD-AS model, if consumers and business become more optimistic about the future direction of the economy and increase spending, then:
(Multiple Choice)
4.8/5 (36)
Exhibit 14-6 Aggregate supply curve
 In Exhibit 14-6, the economy's employment potential is fully exhausted at:
(Multiple Choice)
4.7/5 (46)
Exhibit 14-4 Aggregate supply and demand curves
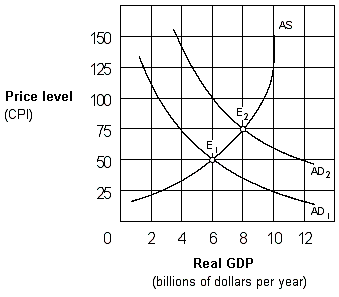 The increase in the price level as the economy moves from E1 to E2 in Exhibit 14-4 represents:
(Multiple Choice)
4.8/5 (38)
Exhibit 14-3 Aggregate supply and demand curves
 In Exhibit 14-3, the change in equilibrium from E1 to E2 represents:
(Multiple Choice)
4.8/5 (40)
Filters
- Essay(0)
- Multiple Choice(0)
- Short Answer(0)
- True False(0)
- Matching(0)