Exam 8:The Classical Long run Model
Exam 1: What is Economics?172 Questions
Exam 2: Scarcity, Choice, and Economic Systems141 Questions
Exam 3: Supply and Demand178 Questions
Exam 4: Working With Supply and Demand53 Questions
Exam 5: What Macroeconomics Tries to Explain106 Questions
Exam 6: Production, Income, and Employment227 Questions
Exam 7: The Price Level and Inflation164 Questions
Exam 8:The Classical Long run Model195 Questions
Exam 9: Economic Growth and Rising Living Standards185 Questions
Exam 10: Economic Fluctuations85 Questions
Exam 11: The Short-run Macro Model210 Questions
Exam 12: Fiscal Policy115 Questions
Exam 13: Money, Banks, and the Federal Reserve255 Questions
Exam 14: The Money Market and Monetary Policy176 Questions
Exam 15: Aggregate Demand and Aggregate Supply185 Questions
Exam 16: Inflation and Monetary Policy141 Questions
Exam 17: Exchange Rates and Macroeconomic Policy156 Questions
Select questions type
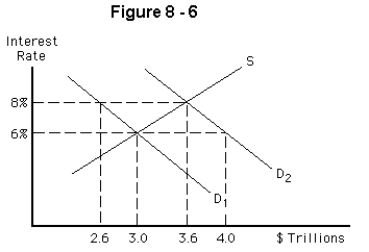 -Refer to Figure 8-6.Suppose that a $1 trillion increase in government spending shifted the demand for funds curve from D₁ to D₂.What would happen to the sum of investment and consumption spending? That sum would
(Multiple Choice)
4.8/5  (43)
(43)
Household saving is the defined as consumption minus disposable income.
(True/False)
4.7/5 (33)
The terms "long-run view" and "classical view" can be used interchangeably.
(True/False)
4.9/5 (32)
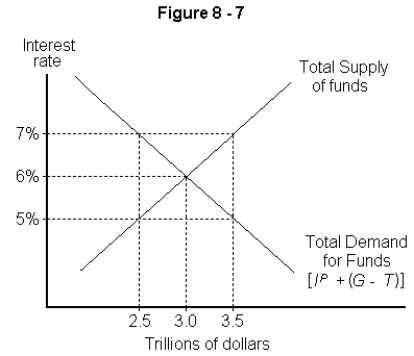 -Refer to Figure 8-7.What is the equilibrium interest rate in the above figure?
(Multiple Choice)
4.9/5 (33)
Assuming the economy was in equilibrium,use the following information to determine the government's budget deficit.
Cansumption Spending tillian Net Taxes .7 tillian Hausehold Seving Investment Spenfing Guvernment Purchases
The government's deficit (surplus)was
(Multiple Choice)
4.8/5 (37)
Say's Law states that by purchasing goods and services,buyers stimulate firms to produce goods and services equal to what has been purchased: Demand creates its own supply.
(True/False)
4.8/5 (36)
If an economy's consumption spending is $5 trillion,investment is $2 trillion,government spending is $1 trillion,net taxes are $1 trillion and household saving is $2 trillion,total income is
(Multiple Choice)
4.8/5 (30)
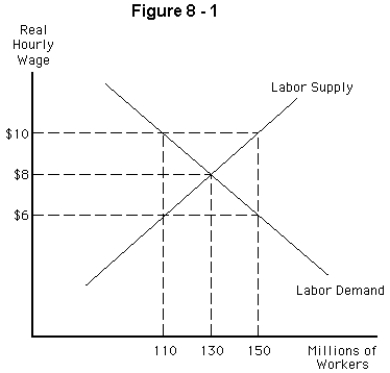 -Refer to Figure 8-1.According to the graph,the equilibrium real hourly wage and quantity of labor employed,respectively,are
(Multiple Choice)
4.8/5 (35)
-Refer to Figure 8-1.If the real hourly wage rate was $6,what would be the effect?
(Multiple Choice)
4.8/5 (35)
Assume the economy is currently in equilibrium.Use the following information to calculate the total value of leakages
Consumption Spending \ 5 trillion Net Taxes \ 2.9 trillion Household Saving \ 2.8 trillion Investment Spending \ 2.3 trillion Government Purchases \ 3.4 trillion
Total injections are
(Multiple Choice)
4.9/5 (39)
What is the equilibrium condition in the loanable funds market?
(Multiple Choice)
4.9/5 (44)
What is the relationship between the government's budget deficit and its tax revenue?
(Multiple Choice)
4.7/5 (44)
In the classical model,the government needs to worry about employment.
(True/False)
4.9/5 (34)
Filters
- Essay(0)
- Multiple Choice(0)
- Short Answer(0)
- True False(0)
- Matching(0)