Exam 10: Completing the Square
Exam 1: Notation and Symbols329 Questions
Exam 2: Simplifying Expressions285 Questions
Exam 3: Paired Data and Graphing Ordered Pairs217 Questions
Exam 4: Multiplication With Exponents300 Questions
Exam 5: The Greatest Common Factor and Factoring by Grouping295 Questions
Exam 6: Reducing Rational Expressions to Lowest Terms263 Questions
Exam 7: Review of Solving Equations262 Questions
Exam 8: The Slope of a Line190 Questions
Exam 9: Rational Exponents264 Questions
Exam 10: Completing the Square187 Questions
Exam 11: Exponential Functions226 Questions
Exam 12: The Circle95 Questions
Exam 13: Sequences190 Questions
Select questions type
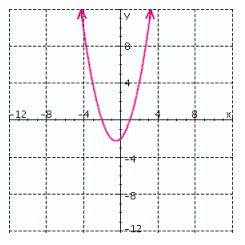
The graph of  is shown below. Use the graph to find the solution set for
  .
. 
(Multiple Choice)
4.8/5  (34)
(34)
For the following equation, find the x -intercepts and the coordinates of the vertex, and choose the corresponding graph. 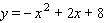
(Multiple Choice)
5.0/5 (32)
In the figure below, triangle ABC has angles  and
and  and height k . Find the lengths of sides AB , BC , and AC , in terms of k .
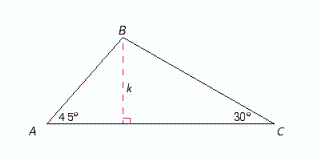
(Multiple Choice)
4.9/5 (26)
Find the coordinates of the vertex, and indicate whether the vertex is the highest point on the graph or the lowest point on the graph. 
(Multiple Choice)
4.7/5 (36)
The total cost (in dollars) for a company to manufacture and sell  items per week is
  , whereas the revenue brought in by selling all
  items is
 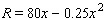 . How many items must be sold to obtain a weekly profit of $500?
(Multiple Choice)
4.9/5 (29)
Fill in the blanks so that the left side is a perfect square trinomial; that is, complete the square.  _____
_____  _____
_____ 
(Short Answer)
4.8/5 (39)
Fill in the blanks so that the left side is a perfect square trinomial; that is, complete the square.  _____
_____  _____
_____ 
(Multiple Choice)
4.9/5 (40)
Use the discriminant to find the number and kind of solutions for the following equation. 
(Multiple Choice)
4.8/5 (33)
Solve the equation. Use factoring or the quadratic formula, whichever is appropriate. (Try factoring first. If you have any difficulty factoring, then go right to the quadratic formula.)  x = __________
(Short Answer)
4.8/5 (29)
The graph of 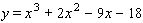 is shown below.
 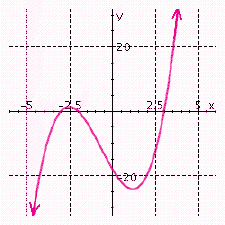 Use the graph to find the solution set for the following inequality.
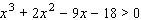
(Short Answer)
4.8/5 (33)
The relationship between the number of calculators  a company sells each day and the price p of each calculator is given by the equation
  . Choose the correct graph of the revenue equation
  , the maximum revenue figure and the price
  that will obtain the maximum revenue figure.
(Multiple Choice)
4.7/5 (33)
Filters
- Essay(0)
- Multiple Choice(0)
- Short Answer(0)
- True False(0)
- Matching(0)