Exam 5: Quadratic Functions and Models
Exam 1: Data, Functions, and Models81 Questions
Exam 2: Linear Functions and Models70 Questions
Exam 3: Exponential Functions and Models110 Questions
Exam 4: Logarithmic Functions and Exponential Modela74 Questions
Exam 5: Quadratic Functions and Models73 Questions
Exam 6: Power, Polynomial, and Rational Functions71 Questions
Exam 7: Systems of Equations and Data in Categories71 Questions
Select questions type
A ball is thrown straight upward from a bridge and then falls all the way to the ground (past the bridge). The ball s height h (in feet) above the ground t seconds after the ball is thrown is given by  . When does the ball hit the ground?
(Multiple Choice)
4.8/5  (25)
(25)
Is a quadratic function an appropriate model for the following data?

(True/False)
4.9/5 (36)
Given the function  , find the average rate of change between
  and
and  .
.
(Multiple Choice)
4.9/5 (29)
The graph of g is given below and represents a translation of the graph of  . Which one of the functions best describes the graph of g .
(Multiple Choice)
4.7/5 (42)
Using the graph below, find the y -value at which the maximum value of the function occurs. 
(Multiple Choice)
4.9/5 (39)
A ball is thrown straight upward from a bridge and then falls all the way to the ground (past the bridge). The ball s height h (in feet) above the ground t seconds after the ball is thrown is given by  . What is the average rate of change of the height of the ball between
  seconds and
  seconds?
(Multiple Choice)
4.9/5 (37)
The graph of g is given below and represents a transformation of the graph of  . Which one of the functions best describes the graph of g .
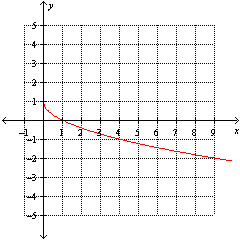
(Multiple Choice)
4.8/5 (33)
In the equation  , the value of a is
  , the value of b is 7 and the value of c is 4.
(True/False)
4.8/5 (24)
Let  and let
  . If
. If  , then the number of x -intercepts for the graph of f is 0.
(True/False)
4.7/5 (32)
Which one of the following graphs illustrate the function  ?
?
(Multiple Choice)
4.8/5 (30)
Which one of the following graphs illustrate the function  ?
?
(Multiple Choice)
4.9/5 (45)
Which one of the following functions translates the graph of  to a new graph g with a reflection about the x -axis, a vertical stretch by a factor of 6, and a horizontal shift left 5 units.
(Multiple Choice)
4.9/5 (37)
Which one of the following functions translates the graph of  to a new graph g with a vertical shift down 3 units and a horizontal shift left 8 units.
(Multiple Choice)
4.8/5 (32)
If the y -values of a set of data increase by different amounts when the x -values increase by the value of 6, then a linear function will best model the data.
(True/False)
4.8/5 (33)
Filters
- Essay(0)
- Multiple Choice(0)
- Short Answer(0)
- True False(0)
- Matching(0)