Exam 1: Data, Functions, and Models
Exam 1: Data, Functions, and Models81 Questions
Exam 2: Linear Functions and Models70 Questions
Exam 3: Exponential Functions and Models110 Questions
Exam 4: Logarithmic Functions and Exponential Modela74 Questions
Exam 5: Quadratic Functions and Models73 Questions
Exam 6: Power, Polynomial, and Rational Functions71 Questions
Exam 7: Systems of Equations and Data in Categories71 Questions
Select questions type
Let f(x) = 3 x  + 4 x
+ 4 x  4. Find f ( 4).
Free
(Multiple Choice)
4.9/5  (33)
(33)
Correct Answer: Verified
D
A table of values is an example of a numeric representation of a function.
Free
(True/False)
4.9/5 (39)
Correct Answer:Verified
True
The cost of college tuition for 12 credit hours at a local college during 2000 to 2008 is shown in the table below. Find the net change in the cost of college tuition from 2000 to 2005 and state if the net change was an increase or decrease. 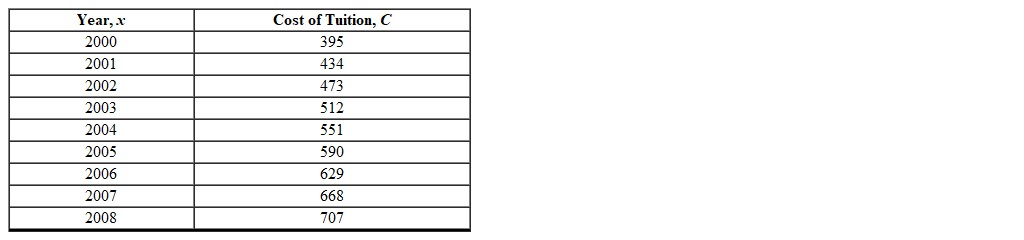
(Multiple Choice)
4.9/5 (39)
The table below gives the cost for one-credit of tuition at various colleges.
The median cost gives a better description than average cost for the tuition costs. 
(True/False)
4.8/5 (38)
All functions can be represented verbally, symbolically, numerically, and graphically.
(True/False)
4.8/5 (25)
The cost for a cell phone plan starts at $29.99 per month plus $0.07 per minute. Which of the following models the monthly cost of the cell phone based on the number of minutes used?
(Multiple Choice)
4.7/5 (45)
Find a function that models the volume V of a box with height x , length 6 x and width x + 8.
(Multiple Choice)
4.8/5 (34)
The number of gallons of water remaining in a pool t hours after it began to drain is illustrated in the table below.
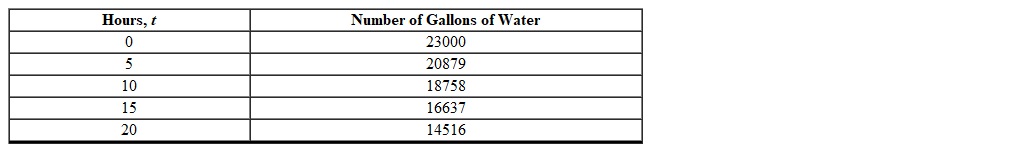 What is the first difference of the number of gallons of water?
(Multiple Choice)
4.9/5 (36)
The table below describes the average temperatures for Portland, OR during a given year. What was the average temperature for May?

(Multiple Choice)
4.8/5 (37)
A population of rabbits was tracked over a 55-day period. The data is shown in the following graph. What was the minimum number of rabbits during this time? 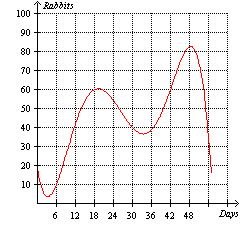
(Multiple Choice)
4.7/5 (35)
Which one of the following models the data graphed in the scatter plot. 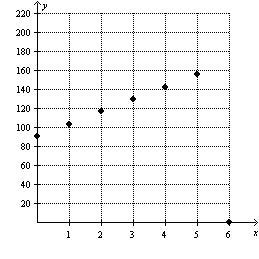
(Multiple Choice)
4.9/5 (34)
The mass of bacteria (in micrograms) in a Petri dish for different times is shown in the table below. By how much did the bacteria grow from 8:30 am to 10:30 am?

(Multiple Choice)
4.9/5 (27)
The mass of bacteria (in micrograms) in a Petri dish for different times is shown in the table below. Approximately what time was the mass of the bacteria 45 mcg?

(Multiple Choice)
4.9/5 (36)
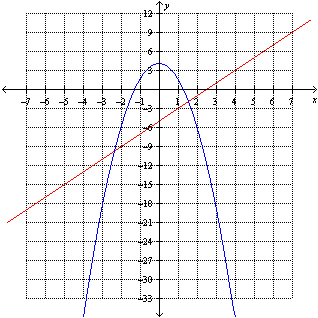
The graphs of  and
and 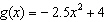 are shown below. Find the value(s) of x for which
  .
. 
(Multiple Choice)
4.9/5 (31)
If the net change of a function f from a to b is zero, then the function must be constant between a and b .
(True/False)
4.8/5 (41)
Filters
- Essay(0)
- Multiple Choice(0)
- Short Answer(0)
- True False(0)
- Matching(0)