Exam 18: Scattergram
Exam 1: The Empirical Approach to Knowledge10 Questions
Exam 2: Types of Empirical Research8 Questions
Exam 3: Scales of Measurement9 Questions
Exam 4: Descriptive, Correlational, and Inferential Statistics5 Questions
Exam 5: Introduction to Sampling9 Questions
Exam 6: Variations on Random Sampling6 Questions
Exam 7: Sample Size9 Questions
Exam 8: Standard Error of the Mean7 Questions
Exam 9: Frequencies, Percentages, and Proportions7 Questions
Exam 10: Shapes of Distributions7 Questions
Exam 11: The Mean: An Average7 Questions
Exam 12: Mean, Median, and Mode12 Questions
Exam 13: Range and Interquartile Range6 Questions
Exam 14: Standard Deviation6 Questions
Exam 15: Z-Score5 Questions
Exam 16: Correlation7 Questions
Exam 17: Pearson-R6 Questions
Exam 18: Scattergram6 Questions
Exam 19: Introduction to Hypothesis Testing11 Questions
Exam 20: Decisions About the Null Hypothesis6 Questions
Exam 21: Introduction to the T-Test7 Questions
Exam 22: Independent Samples T-Test6 Questions
Exam 23: Dependent Samples T-Test6 Questions
Exam 24: One Sample T-Test5 Questions
Exam 25: Reports of the Results of T-Tests5 Questions
Exam 26: One-Way Anova7 Questions
Exam 27: Two-Way Anova5 Questions
Exam 28: Chi-Square Test5 Questions
Exam 29: Limitations of Significance Testing5 Questions
Exam 30: Effect Size8 Questions
Exam 31: Coefficient of Determination5 Questions
Exam 32: Multiple Correlation5 Questions
Exam 33: Simple and Multiple Regression5 Questions
Select questions type
A scattergram is statistical figure that illustrates the coefficient of determination between two variables.
Free
(True/False)
4.9/5  (27)
(27)
Correct Answer: Verified
False
Would you expect a positive, negative or no relationship in the following scattergram? 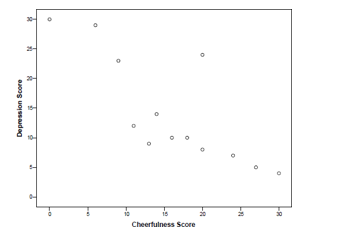
Free
(Short Answer)
4.7/5 (29)
Correct Answer:Verified
Negative
In an inverse(negative) relationship what pattern do dots form in a scattergram?
Free
(Multiple Choice)
4.9/5 (41)
Correct Answer:Verified
B
Would you expect a positive, negative or no relationship in the following scattergram? 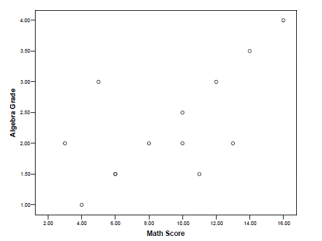
(Short Answer)
4.8/5 (38)
In a perfect direct (positive) relationship what pattern do dots form in a scattergram?
(Multiple Choice)
4.8/5 (31)
Filters
- Essay(0)
- Multiple Choice(0)
- Short Answer(0)
- True False(0)
- Matching(0)