Exam 5: The Wealth of Nations: Defining and Measuring Macroeconomic Aggregates
Exam 1: The Principles and Practice of Economics103 Questions
Exam 2: Economic Methods and Economic Questions94 Questions
Exam 3: Optimization: Doing the Best You Can94 Questions
Exam 4: Demand, Supply, and Equilibrium185 Questions
Exam 5: The Wealth of Nations: Defining and Measuring Macroeconomic Aggregates224 Questions
Exam 6: Aggregate Incomes194 Questions
Exam 7: Economic Growth230 Questions
Exam 8: Why Isn't the Whole World Developed?126 Questions
Exam 9: Employment and Unemployment247 Questions
Exam 10: Credit Markets204 Questions
Exam 11: The Monetary System211 Questions
Exam 12: Short-Run Fluctuations177 Questions
Exam 13: Countercyclical Macroeconomic Policy177 Questions
Exam 14: Macroeconomics and International Trade196 Questions
Exam 15: Open Economy Macroeconomics180 Questions
Select questions type
The value of a country's exports during a particular year was $120,000 and the value of its imports was $85,000.Which of the following is true?
(Multiple Choice)
4.7/5  (31)
(31)
The following table contains statistics for the country of Gregorville in 2017, a country in which all must either attend school, be available for work, or be retired.
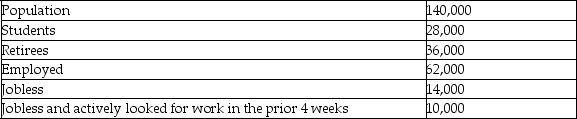 -Refer to the table above.What is the labor force participation if 5,000 of those actively looking for a job find one?
(Multiple Choice)
4.7/5 (40)
A retailer buys goods worth $15,000 from a manufacturer and sells them for $18,250.The retailer adds a value of ________ to the production process.
(Multiple Choice)
4.9/5 (43)
Scenario: A typical resident of the country of Univertopia consumes a simple basket of goods consisting of soda, pizza, and Frisbees. The base year's basket contains 500 sodas, 200 pizzas, and 40 Frisbees. The prices of these goods over 8 years are given in the table.
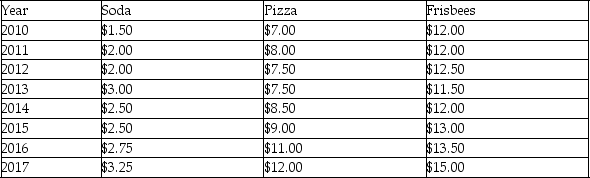 -Refer to the scenario above.Using 2014 as the base year,what is the Consumer Price Index for 2016?
(Multiple Choice)
4.9/5 (38)
Genovia produced 10 million tons of wheat in a particular year.Of this,1 million tons had to be thrown away because of a pest infestation.How would this affect the calculation of the GDP of the country for that year?
(Essay)
4.8/5 (38)
Which of the following will be included in the calculation of GDP using the income-based method of national accounting?
(Multiple Choice)
4.9/5 (33)
The following table contains statistics for the country of Gregorville in 2017, a country in which all must either attend school, be available for work, or be retired.
-Refer to the table above.What is the labor force if 5,000 of those actively looking for a job find one?
(Multiple Choice)
4.7/5 (41)
Which of the following questions cannot be answered using the concepts of macroeconomics?
(Multiple Choice)
4.8/5 (37)
The table below shows a list of goods purchased by Susan in two different years.
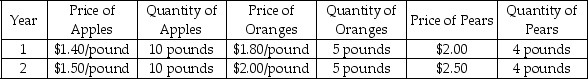 Calculate the Consumer Price Index for Year 2,taking Year 1 as the base year.
(Essay)
5.0/5 (40)
Which of the following is omitted in the calculation of GDP?
(Multiple Choice)
4.9/5 (36)
In 2015,which category made up the smallest share of U.S.GDP?
(Multiple Choice)
4.7/5 (36)
Rita cooked a meal,which would have been worth $100 at the nearest eatery,for her family.What impact would this have on the calculation of GDP? Explain your answer.
(Essay)
4.8/5 (38)
An apparel manufacturer bought raw materials worth $60,000 in a particular year and earned a total revenue of $90,000.If the manufacturer had no other expenditure,it added a value of ________ to the production process.
(Multiple Choice)
4.8/5 (32)
Why are the values of inputs not included in the calculation of the GDP?
(Essay)
4.8/5 (32)
The following table contains prices and quantities for the three goods produced in the country of Linfieldia.
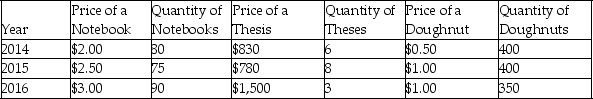 -Refer to the table above.Assuming that 2015 is the base year,what is the GDP deflator for 2016?
(Multiple Choice)
4.9/5 (42)
Which of the following will be included in the calculation of GDP using the expenditure method?
(Multiple Choice)
4.7/5 (38)
The country described in the table below produces and consumes only three goods: energy drinks, pizza, and t-shirts. The quantity produced and price of each good in 2016 and 2017 are provided.
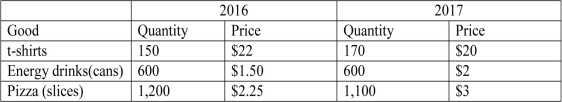 -Refer to the above table.Assuming that 2016 is the base year,by what percentage did prices change between 2016 and 2017?
(Multiple Choice)
4.9/5 (31)
Filters
- Essay(0)
- Multiple Choice(0)
- Short Answer(0)
- True False(0)
- Matching(0)