Exam 19: Applying graphs to economics
Exam 1: Thinking like an economist89 Questions
Exam 2: Production possibilities and opportunity cost123 Questions
Exam 3: Market demand and supply123 Questions
Exam 4: Markets in action123 Questions
Exam 5: Elasticity of demand and supply124 Questions
Exam 6: Production costs123 Questions
Exam 7: Perfect competition125 Questions
Exam 8: Monopoly123 Questions
Exam 9: Monopolistic competition and oligopoly124 Questions
Exam 10: Policy issues: resource taxes and climate change124 Questions
Exam 11: Measuring the size of the economy124 Questions
Exam 12: Business cycles and economic growth124 Questions
Exam 13: Inflation and unemployment121 Questions
Exam 14: A simple model of the macro economy134 Questions
Exam 15: The monetary and financial system124 Questions
Exam 16: Macroeconomic policy I: monetary policy124 Questions
Exam 17: Macroeconomic policy II: fiscal policy123 Questions
Exam 18: International trade and finance133 Questions
Exam 19: Applying graphs to economics37 Questions
Select questions type
An inverse relationship is a negative causation between two variables.
Free
(True/False)
4.7/5  (37)
(37)
Correct Answer: Verified
False
Which of the following pairs is the most likely to exhibit an inverse relationship?
Free
(Multiple Choice)
4.8/5 (32)
Correct Answer:Verified
D
A direct relationship is a relationship between two variables in which they move in different directions (if one increases,the other decreases).
Free
(True/False)
4.8/5 (39)
Correct Answer:Verified
False
A graph can be used to illustrate the relationship between the price of compact discs and the quantity of compact discs demanded.If there is evidence that buyers' income also influences the demand for compact discs,then a movement along the curve can be caused by a change in the price of compact discs.
(True/False)
4.8/5 (39)
Exhibit 1A-4 Straight line
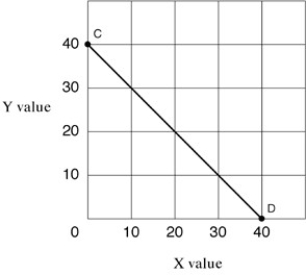 -In Exhibit 1A-4,the slope of straight line CD is:
(Multiple Choice)
5.0/5 (41)
Exhibit 1A-2 Straight line
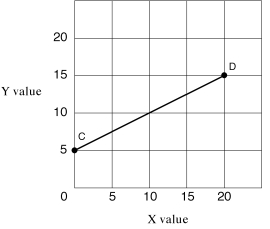 -Straight line CD in Exhibit 1A-2 shows which of the following?
(Multiple Choice)
4.9/5 (42)
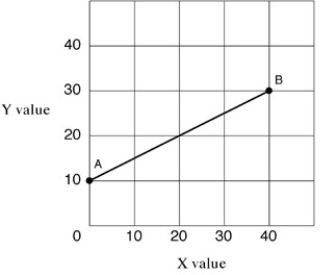
Exhibit 1A-3 Straight line
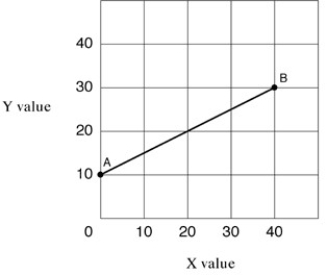 -In Exhibit 1A-3,the slope of straight line AB is:
(Multiple Choice)
4.9/5 (38)
Exhibit 1A-4 Straight line
-Straight line CD in Exhibit 1A-4 shows which of the following?
(Multiple Choice)
4.7/5 (35)
Direct relationships are illustrated using upward-sloping lines and curves.
(True/False)
4.8/5 (31)
Measured between two points on a curve,the ratio of the change in the variable on the vertical axis to the change in the variable on the horizontal axis is the:
(Multiple Choice)
4.8/5 (36)
A horizontal line indicates an independent relationship between two variables
(True/False)
4.9/5 (37)
Exhibit 1A-3 Straight line
-In Exhibit 1A-3,the slope of straight line AB is:
(Multiple Choice)
4.7/5 (38)
Exhibit 1A-4 Straight line
-In Exhibit 1A-4,as X increases along the horizontal axis,corresponding to points C-D on the line,the Y values decrease.The relationship between the X and Y variables is:
(Multiple Choice)
4.9/5 (28)
Exhibit 1A-3 Straight line
-As shown in Exhibit 1A-3,the intercept of straight line AB is:
(Multiple Choice)
4.8/5 (31)
Exhibit 1A-4 Straight line
-In Exhibit 1A-4,the slope for straight line CD is:
(Multiple Choice)
4.8/5 (39)
Exhibit 1A-1 Straight line
 -Straight line AB in Exhibit 1A-1 shows which of the following?
(Multiple Choice)
4.8/5 (40)
Exhibit 1A-6 Straight-line relationship
 -Which of the following would cause a shift in the relationship shown in Exhibit 1A-6?
(Multiple Choice)
4.8/5 (42)
Filters
- Essay(0)
- Multiple Choice(0)
- Short Answer(0)
- True False(0)
- Matching(0)