Exam 19: Applying graphs to economics
Exam 1: Thinking like an economist89 Questions
Exam 2: Production possibilities and opportunity cost123 Questions
Exam 3: Market demand and supply123 Questions
Exam 4: Markets in action123 Questions
Exam 5: Elasticity of demand and supply124 Questions
Exam 6: Production costs123 Questions
Exam 7: Perfect competition125 Questions
Exam 8: Monopoly123 Questions
Exam 9: Monopolistic competition and oligopoly124 Questions
Exam 10: Policy issues: resource taxes and climate change124 Questions
Exam 11: Measuring the size of the economy124 Questions
Exam 12: Business cycles and economic growth124 Questions
Exam 13: Inflation and unemployment121 Questions
Exam 14: A simple model of the macro economy134 Questions
Exam 15: The monetary and financial system124 Questions
Exam 16: Macroeconomic policy I: monetary policy124 Questions
Exam 17: Macroeconomic policy II: fiscal policy123 Questions
Exam 18: International trade and finance133 Questions
Exam 19: Applying graphs to economics37 Questions
Select questions type
Exhibit 1A-5 Straight line
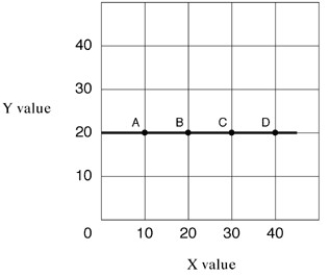 -Straight line A-D in Exhibit 1A-5 shows which of the following?
(Multiple Choice)
4.9/5  (41)
(41)
Exhibit 1A-2 Straight line
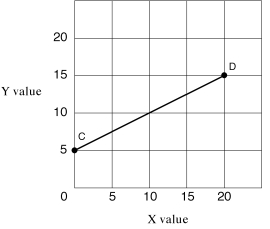 -In Exhibit 1A-2,as X increases along the horizontal axis,corresponding to points C-D on the line,the Y values increase.The relationship between the X and Y variables is:
(Multiple Choice)
4.8/5 (44)
A change in a third variable not on either axis of a graph is illustrated with:
(Multiple Choice)
5.0/5 (32)
If the coordinates are x1=3,y1=6 and x2=1,y2=2.The slope of the line is:
(Multiple Choice)
4.8/5 (50)
Exhibit 1A-1 Straight line
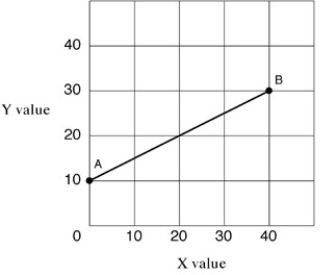 -Straight line AB in Exhibit 1A-1 shows which of the following?
(Multiple Choice)
4.8/5 (39)
Exhibit 1A-3 Straight line
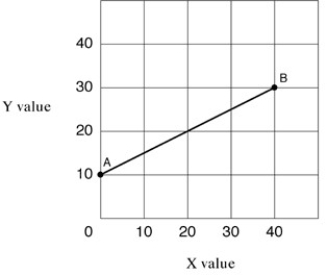 -As shown in Exhibit 1A-3,the slope of straight line AB:
(Multiple Choice)
4.8/5 (39)
Exhibit 1A-5 Straight line
-In Exhibit 1A-5,as X increases along the horizontal axis,corresponding to points A-D on the line,the Y values remain unchanged at 20 units.The relationship between the X and Y variables is:
(Multiple Choice)
4.8/5 (35)
Exhibit 1A-6 Straight-line relationship
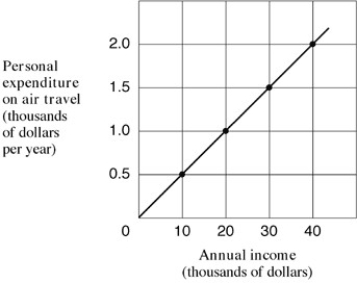 -What is the slope of the line shown in Exhibit 1A-6?
(Multiple Choice)
4.8/5 (31)
Exhibit 1A-1 Straight line
-In Exhibit 1A-1,as X increases along the horizontal axis,corresponding to points A-B on the line,the Y values increase.The relationship between the X and Y variables is:
(Multiple Choice)
4.8/5 (39)
Exhibit 1A-5 Straight line
-In Exhibit 1A-5,the slope of straight line A-D is:
(Multiple Choice)
4.9/5 (31)
When one variable increases,the other variable increases - it is called:
(Multiple Choice)
4.9/5 (34)
In a graphic relationship,shifts in a curve are caused by a change in:
(Multiple Choice)
4.7/5 (32)
Exhibit 1A-5 Straight line
-In Exhibit 1A-5,the slope of the straight line A-D is:
(Multiple Choice)
4.8/5 (34)
Filters
- Essay(0)
- Multiple Choice(0)
- Short Answer(0)
- True False(0)
- Matching(0)