Exam 2: Measuring and Accounting for the Output of a Nation: GDP
Assume that China's entire tertiary sector (services) is non-traded. Use the share of services in China's GDP statistics presented in this chapter to help answer some of the following questions.
a. Is China's relative price of services to primary and secondary output prices higher or lower than in the United States (use your good judgment)?
b. Assume that the exchange rate is at purchasing power parity (PPP) for traded goods. If we use that exchange rate to convert Chinese GDP into U.S. dollars, how would that distort your estimate of Chinese GDP given your answer in (a)?
c. Suggest a better way to approach the problem of converting Chinese GDP into U.S. dollars.
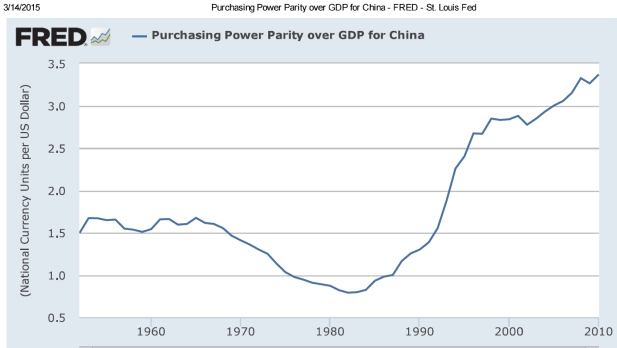
d. Observe Data (PPPTT2CNA618NUPN) in FRED. How does this approach compare to your answer in (c)? Apply the most recent PPP exchange rate found in this series to nominal Chinese GDP. How much larger is China's US$ GDP compared to when you use the actual exchange rate for the same period?
a. China's service sector is relatively unskilled, abundant, and underemployed. Wages in this sector are relatively low compared to the more dynamic tradeable sector vis à vis the United States. Prices in this sector also are relatively low. One should keep in mind that in the United States the minimum allowable wage at the national level is USD 7.25 per hour and higher in many individual states. Prices in turn in the non-tradeable services sector tend to be relatively lower in China.
b. If we assume that PPP holds then the Chinese service sector not only has a relatively low price-it also has an absolutely lower price. Thus, simply applying the PPP exchange rate will preserve the relatively low wage in USD terms and underweight the real value of output in China's services sector. In other words, we will underestimate Chinese GDP if we ignore relatively low service sector prices in China.
c. Ideally, we would want to apply each USD price to every unit of real output (goods and services in China), that is, China USD GDP = P$,T x QChina,T + P$,S x QChina,S where T and S stand for traded goods and S stands for non-traded services. Thus we would be valuing Chinese output at U.S. prices and better be able to compare China's real output with that of the United States.
d. This approach does in effect attempt to assign USD prices to all Chinese goods and services as recommended in (c). In the process, it attempts to identify an exchange rate that gives on average the same market basket of goods (tradeable plus non-tradeable) the same price USD price in each country.
Here we have a PPP exchange rate of RMB 3.37/USD compared to a market rate in 2010 of 6.77. This would imply that Chinese USD GDP would be twice as large using the PPP exchange rate (2.01 times to be precise). In other words, China's 2010 GDP would be in USD: USD 11.9 trillion instead of USD 5.9 trillion. Wow-what a difference.
 More information on this series can be found at: http://pwt.econ.upenn.edu/Documentation/append61.pdf
For proper citation, see http://pwt.econ.upenn.edu/php_site/pwt_index.php
Using the table found below:
a. Explain the classical relationship between other stakeholders and shareholders in a capitalist system.
b. Explain the relationship among the various stakeholders in China. Compare and contrast to your answer in (a).
c. Using one of the key drivers for China presented in Chapter 1, explain the difficulties of managing a mixed-market economy such as China's.
a. The classical view (with particular currency in U.S. business schools) is that since the shareholder is the last to receive income from the company, they will be forced to satisfy all of the earlier stakeholders (customers through to the government) so as to allow the shareholder to receive a competitive income. By maximizing shareholder value, then, we can achieve a Pareto optimal outcome in terms of the other stakeholders. In other words, for example, if in a competitive labor market shareholders do not compensate workers adequately, the firm will be unable to attract employees. So too for the relationship between shareholders and other stakeholders.
b. China is a much more complex process since the government can be a shareholder, taxer, lender, supplier, and controller of labor markets all at once. When we seek to maximize the interest of a shareholder in this case, the other (minority) stakeholders may suffer. Conflicts of interest can arise.
c. Based on the answer in (b) it would appear that the key driver, The role of the Government, creates complex problems and (as we shall see) complex solutions when operating in a mixed economy such as China.
Income Statement for a Typical Firm in an Economy*
* Assume this is a 50/50 joint venture with a foreign company and that inventories decreased during the period by 0.14.
Explain why during an economic downturn, U.S. GDP might actually be underestimated while Chinese GDP might actually be overestimated.
Local authorities in China have been rewarded/promoted based on how well they meet numerical growth targets. Since GDP data is based on output (value-added production) primarily in China (rather than expenditures) and so there is a tendency for local officials to report more output in bad times so as to appear to be meeting the Five Year Plan targets. Meanwhile in the United States, bonuses are typically not rewarded during a recession, but are during an upturn-the same story applies to tax payments. Thus, managers at companies attempt to shift costs into bad years so as to sweep all the bad news into years where it will not matter anyhow. This tends to make the bad year look worse than it actually is.
If a 2,000- square-foot apartment in New York sells for US$1.5 million, what is its per-square-meter RMB price and total RMB price. Be sure to use proper Chinese numerical units.
Using the table below (mind the footnote at the bottom of the table):
a. Calculate GDP and GNP based on a method used primarily in China. Identify the method.
b. Calculate GDP and GNP based on a method used primarily in the United States. Identify the method.
Go to FRED (the Federal Reserve Economic Database) and find three different measures of Chinese GDP. Define each measure based on its frequency (quarterly vs. annual), basis for measure (e.g., expenditure approach), and whether it is expressed in real or nominal terms.
Filters
- Essay(0)
- Multiple Choice(0)
- Short Answer(0)
- True False(0)
- Matching(0)