Exam 3: Central Tendency.
Exam 1: Introduction to Statistics.83 Questions
Exam 2: Frequency Distributions.83 Questions
Exam 3: Central Tendency.88 Questions
Exam 4: Variability.85 Questions
Exam 5: z-Scores: Location of Scores and Standardized Distributions.86 Questions
Exam 6: Probability.84 Questions
Exam 7: Probability and Samples: The Distribution of Sample Means.84 Questions
Exam 8: Introduction to Hypothesis Testing.84 Questions
Exam 9: Introduction to the t Statistic85 Questions
Exam 10: The t Test for Two Independent Samples84 Questions
Exam 11: The t Test for Two Related Samples85 Questions
Exam 12: Introduction to Analysis of Variance84 Questions
Exam 13: Repeated-Measures and Two-Factor Analysis of Variance85 Questions
Exam 14: Correlation and Regression.85 Questions
Exam 15: The Chi-Square Statistic: Tests for Goodness of Fit and Independence84 Questions
Select questions type
For the scores in the following frequency distribution table,the mean is M = 3.
X f 4 1 3 4 2 2
Free
(True/False)
4.9/5  (36)
(36)
Correct Answer: Verified
False
A sample of n = 5 scores has a mean of M = 12.One new score is added to the sample,and the new mean is calculated to be M = 11.What is the value of new score?
Free
(Multiple Choice)
4.9/5 (34)
Correct Answer:Verified
B
For a perfectly symmetrical distribution with µ = 30,what is the mode?
Free
(Multiple Choice)
4.8/5 (29)
Correct Answer:Verified
D
A sample of n = 10 scores has a mean of 50.A second sample has n = 5 scores and M = 60.If the two samples are combined,the combined sample mean will be greater than 55.
(True/False)
4.9/5 (36)
The mean is considered to be the "balance point" for a distribution because exactly half of the scores are located above the mean and exactly half are below the mean.
(True/False)
4.9/5 (40)
Explain why it is necessary to have more than one standard procedure for defining and measuring central tendency.
(Essay)
4.7/5 (29)
In a sample of n = 6 scores,the smallest score is X = 3,the largest score is X = 10,and the mean is M = 6.If the largest score is changed from X = 10 to X = 22,then what is the value of the new mean?
(Multiple Choice)
4.8/5 (32)
A sample of n = 8 scores has a mean of M = 20.After one score is removed from the sample,the mean is calculated to be M = 23.The removed score must have a value greater than 20.
(True/False)
4.9/5 (31)
A sample has a mean of M = 86.If one new person is added to the sample,what effect will it have on the sample mean?
(Multiple Choice)
4.8/5 (26)
A sample has n = 5 scores: 2,4,5,8,and 11.The median for the sample is 6.5.
(True/False)
4.8/5 (32)
A population of scores has a mean of µ = 26,a median of 23,and a mode of 22.What is the most likely shape for the population distribution?
(Multiple Choice)
4.8/5 (35)
Changing the value of a score in a distribution will always change the value of the mean.
(True/False)
4.8/5 (24)
Find the mean,the median,and the mode for the set of scores in the frequency distribution histogram below.
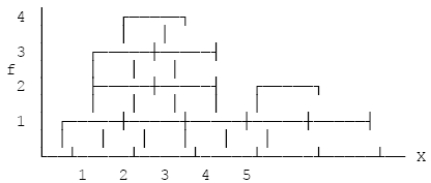
(Short Answer)
4.8/5 (22)
A population has a mean of µ = 30.If 3 points are added to each score,what is the mean for the new distribution?
(Multiple Choice)
4.8/5 (24)
A sample of n = 6 scores has a mean of M = 9.If one individual with a score of X = 4 is removed from the sample,the new mean will be M = 10.
(True/False)
4.8/5 (34)
For a positively skewed distribution,the mean usually has a larger value than either the median or the mode.
(True/False)
4.8/5 (33)
For a distribution with one or two extreme scores,the median is usually a more representative value than the mean.
(True/False)
4.8/5 (27)
Under what circumstances is the median likely to produce a better measure of central tendency than the mean?
(Multiple Choice)
4.8/5 (34)
What is the mean for the population of scores shown in the frequency distribution table? \ X 5 1 4 2 3 3 2 4 1 2
(Multiple Choice)
4.7/5 (33)
Filters
- Essay(0)
- Multiple Choice(0)
- Short Answer(0)
- True False(0)
- Matching(0)