Exam 2: Frequency Distributions.
Exam 1: Introduction to Statistics.83 Questions
Exam 2: Frequency Distributions.83 Questions
Exam 3: Central Tendency.88 Questions
Exam 4: Variability.85 Questions
Exam 5: z-Scores: Location of Scores and Standardized Distributions.86 Questions
Exam 6: Probability.84 Questions
Exam 7: Probability and Samples: The Distribution of Sample Means.84 Questions
Exam 8: Introduction to Hypothesis Testing.84 Questions
Exam 9: Introduction to the t Statistic85 Questions
Exam 10: The t Test for Two Independent Samples84 Questions
Exam 11: The t Test for Two Related Samples85 Questions
Exam 12: Introduction to Analysis of Variance84 Questions
Exam 13: Repeated-Measures and Two-Factor Analysis of Variance85 Questions
Exam 14: Correlation and Regression.85 Questions
Exam 15: The Chi-Square Statistic: Tests for Goodness of Fit and Independence84 Questions
Select questions type
If a frequency distribution is presented in a polygon,then the scores were measured on an interval or a ratio scale.
Free
(True/False)
4.8/5  (34)
(34)
Correct Answer: Verified
True
In a grouped frequency distribution table,the top value in each class interval should be a multiple of the interval width.
Free
(True/False)
4.9/5 (39)
Correct Answer:Verified
False
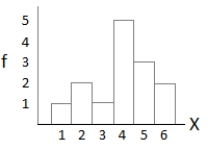
For the following scores
a.construct a frequency distribution table.
b.sketch a histogram of the frequency distribution.6, 4, 3, 5, 4, 2, 4
5, 4, 6, 1, 4, 5, 2
Free
(Essay)
4.9/5 (38)
Correct Answer:Verified
a.
b.
For the following distribution,11 people have scores greater than X = 14.
X 20-24 2 15-19 5 10-14 4 5-9 1
(True/False)
4.8/5 (41)
In a grouped frequency distribution table,one interval is identified as 30-34.This interval has a width of 5 points.
(True/False)
4.8/5 (31)
If a distribution of scores is shown in a bar graph,you know that the scores were measured on a(n)_________ scale of measurement.
(Multiple Choice)
4.8/5 (39)
The normal distribution is an example of a symmetrical distribution.
(True/False)
5.0/5 (33)
A sample of n = 15 scores ranges from a high of X = 11 to a low of X = 3.If these scores are placed in a frequency distribution table,how many X values will be listed in the first column?
(Multiple Choice)
4.9/5 (32)
For the following distribution,how many people had scores less than X = 19? X f 20-24 2 15-19 5 10-14 4 5-9 1
(Multiple Choice)
4.8/5 (29)
A grouped frequency distribution table lists one interval as 20-29.The width of this interval is 9 points.
(True/False)
4.8/5 (34)
If it is appropriate to present a distribution of scores in a polygon,then it would also be appropriate to present the scores in a bar graph.
(True/False)
4.9/5 (39)
Briefly explain what information is available in a regular frequency distribution table that is not available in a grouped table.
(Essay)
4.9/5 (41)
A frequency distribution graph represents frequencies with vertical bars without space between them.What scale of measurement was used to measure the scores?
(Multiple Choice)
4.8/5 (42)
What is the shape of the distribution for the following set of data? X 5 1 4 1 3 2 2 4 1 5
(Multiple Choice)
4.7/5 (27)
If a set of scores covers a range of 80 points,then the grouped frequency table for the scores should use an interval width of 8 points.
(True/False)
4.8/5 (31)
For the following frequency distribution,what is ?X? X 30-34 1 25-29 1 20-24 3 15-19 2 10-14 1
(Multiple Choice)
4.9/5 (29)
In the following distribution,the scores are grouped into class intervals that are each 5 points wide.
X f 20-24 2 15-19 5 10-14 4 5-9 1
(True/False)
4.9/5 (32)
Filters
- Essay(0)
- Multiple Choice(0)
- Short Answer(0)
- True False(0)
- Matching(0)