Exam 33: Aggregate Demand and Aggregate Supply
Exam 1: The Core Principles of Economics156 Questions
Exam 2: Demand: Thinking Like a Buyer165 Questions
Exam 3: Supply: Thinking Like a Seller168 Questions
Exam 4: Equilibrium: Where Supply Meets Demand191 Questions
Exam 5: Elasticity: Measuring Responsiveness182 Questions
Exam 6: When Governments Intervene in Markets265 Questions
Exam 7: Welfare and Efficiency208 Questions
Exam 8: Gains From Trade161 Questions
Exam 9: International Trade215 Questions
Exam 10: Externalities and Public Goods241 Questions
Exam 11: Labor Demand and Supply223 Questions
Exam 12: Wages, Workers, and Management154 Questions
Exam 13: Inequality, Social Insurance, and Redistribution190 Questions
Exam 14: Market Structure and Market Power216 Questions
Exam 15: Entry, Exit, and Long-Run Profitability217 Questions
Exam 16: Business Strategy148 Questions
Exam 17: Sophisticated Pricing Strategies170 Questions
Exam 18: Game Theory and Strategic Choices227 Questions
Exam 19: Decisions Involving Uncertainty201 Questions
Exam 20: Decisions With Private Information156 Questions
Exam 21: Sizing up the Economy Using Gdp204 Questions
Exam 22: Economic Growth137 Questions
Exam 23: Unemployment167 Questions
Exam 24: Inflation and Money158 Questions
Exam 25: Consumption and Saving158 Questions
Exam 26: Investment150 Questions
Exam 27: The Financial Sector137 Questions
Exam 28: International Finance and the Exchange Rate129 Questions
Exam 29: Business Cycles149 Questions
Exam 30: IS-MP Analysis: Interest Rates and Output123 Questions
Exam 31: Phillips Curve131 Questions
Exam 32: The Fed Model: Linking Interest Rates, Output, and Inflation125 Questions
Exam 33: Aggregate Demand and Aggregate Supply169 Questions
Exam 34: Monetary Policy130 Questions
Exam 35: Government Spending, Taxes, and Fiscal Policy178 Questions
Exam 36: Appendix: Aggregate Expenditure and the Multiplier78 Questions
Select questions type
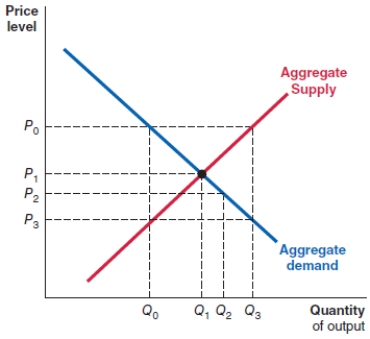
Consider the graph shown here. The equilibrium price level is:
(Multiple Choice)
4.9/5  (38)
(38)
What is meant by the interest rate effect of a change in the aggregate price level, and why does it help explain the shape of the aggregate demand curve?
(Essay)
4.9/5 (33)
Consider the graph shown here. The equilibrium level of GDP is:

(Multiple Choice)
5.0/5 (41)
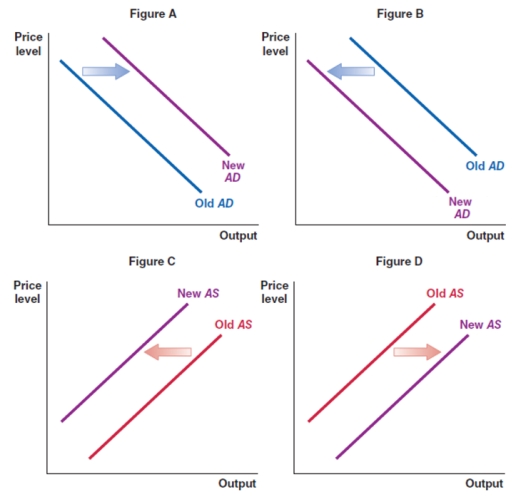
The stock market rises consistently and reaches a record high. Ceteris paribus, which of the graphs shows the correct effect on the AD-AS framework?
(Multiple Choice)
4.8/5 (38)
(Figure: Aggregate Demand) Use Figure: Aggregate Demand. The quantity of output demanded at a price level is 120 is:
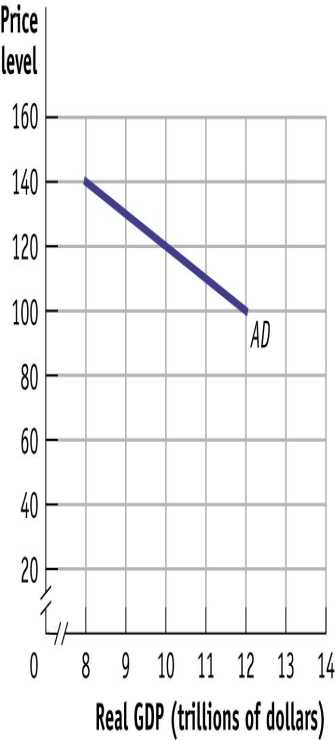
(Multiple Choice)
4.8/5 (33)
What is meant by sticky wages, and how do they explain the shape of the short-run aggregate supply curve?
(Essay)
4.7/5 (33)
In the AD-AS framework, macroeconomic equilibrium occurs when:
(Multiple Choice)
4.8/5 (49)
A previously enacted steel tariff is removed. Ceteris paribus, which of the graphs shows the correct effect on the AD-AS framework for the country exporting steel?
(Multiple Choice)
4.9/5 (45)
Suppose the economy is in a recession. A fiscal policy that would counteract contractionary pressures is a(n):
(Multiple Choice)
4.8/5 (45)
In 2019, South Africa's consumer confidence index dipped sharply. Ceteris paribus, which of the graphs shows the correct effect on aggregate demand?

(Multiple Choice)
4.9/5 (44)
You are an analyst preparing a forecast of the effects of macroeconomic changes in the economy. Which graph shows the correct effect on prices and GDP when the central bank engages in contractionary monetary policy?
(Multiple Choice)
4.8/5 (33)
The aggregate demand curve is negatively sloped in part because of the impact of the:
(Multiple Choice)
4.8/5 (32)
You are an analyst preparing a forecast of the effects of macroeconomic changes in the economy. Which graph shows the correct effect on prices and GDP when the government engages in expansionary fiscal policy?
(Multiple Choice)
4.8/5 (42)
(Figure: Aggregate Supply) Use Figure: Aggregate Supply. At point F, potential output is _____ than actual output, and unemployment is _____.
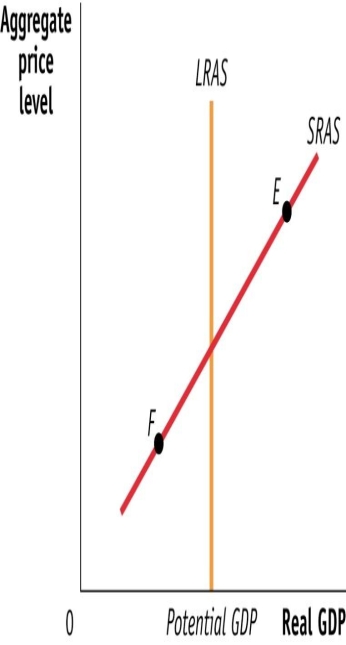
(Multiple Choice)
4.8/5 (46)
Minimum wages rise sharply in the economy. Ceteris paribus, which of the graphs shows the correct effect on the AD-AS framework?
(Multiple Choice)
4.8/5 (32)
The U.S. dollar appreciates. Ceteris paribus, which of the graphs shows the correct effect on aggregate demand?
(Multiple Choice)
4.9/5 (39)
Filters
- Essay(0)
- Multiple Choice(0)
- Short Answer(0)
- True False(0)
- Matching(0)