Exam 4: Asupply and Demand: Applications and Extensions
Exam 1: The Economic Approach210 Questions
Exam 2: Asome Tools of the Economist257 Questions
Exam 3: Asupply,demand,and the Market Process405 Questions
Exam 4: Asupply and Demand: Applications and Extensions331 Questions
Exam 5: Difficult Cases for the Market and the Role of Government168 Questions
Exam 6: The Economics of Collective Decision-Making180 Questions
Exam 7: Ataking the Nations Economic Pulse288 Questions
Exam 8: Economic Fluctuations, unemployment, and Inflation242 Questions
Exam 9: Aan Introduction to Basic Macroeconomic Markets261 Questions
Exam 10: Dynamic Change, economic Fluctuations, and the Ad-As Model224 Questions
Exam 11: Fiscal Policy: the Keynesian View and Historical Perspective139 Questions
Exam 12: Fiscal Policy, incentives, and Secondary Effects171 Questions
Exam 13: Amoney and the Banking System260 Questions
Exam 14: Modern Macroeconomics and Monetary Policy220 Questions
Exam 15: Stabilization Policy, output, and Employment177 Questions
Exam 16: Creating an Environment for Growth and Prosperity142 Questions
Exam 17: Institutions,policies,and Cross-Country Differences in Income and Growth153 Questions
Exam 18: Gaining From International Trade222 Questions
Exam 19: International Finance and the Foreign Exchange Market162 Questions
Exam 20: Consumer Choice and Elasticity223 Questions
Exam 21: Acosts and the Supply of Goods231 Questions
Exam 22: Aprice Takers and the Competitive Process260 Questions
Exam 23: Price-Searcher Markets With Low Entry Barriers216 Questions
Exam 24: Aprice-Searcher Markets With High Entry Barriers254 Questions
Exam 25: The Supply of and Demand for Productive Resources200 Questions
Exam 26: Earnings, productivity, and the Job Market109 Questions
Exam 27: Investment, the Capital Market, and the Wealth of Nations129 Questions
Exam 28: Income Inequality and Poverty136 Questions
Exam 29: Government Spending and Taxation79 Questions
Exam 30: The Economics of Social Security54 Questions
Exam 31: The Stock Market: Its Function, Performance, and Potential As an Investment Opportunity70 Questions
Exam 32: Great Debates in Economics: Keynes Versus Hayek8 Questions
Exam 33: The Crisis of 2008: Causes and Lessons for the Future64 Questions
Exam 34: Lessons From the Great Depression60 Questions
Exam 35: Lessons From Japan and Canada72 Questions
Exam 36: The Federal Budget and the National Debt97 Questions
Exam 37: The Economics of Healthcare68 Questions
Exam 38: Education: Problems and Performance60 Questions
Exam 39: Earnings Differences Between Men and Women47 Questions
Exam 40: Do Labor Unions Increase the Wages of Workers74 Questions
Exam 41: The Question of Resource Exhaustion61 Questions
Exam 42: Difficult Environmental Cases and the Role of Government63 Questions
Select questions type
Use the figure below to answer the following question(s).
Figure 4-10
 -Refer to Figure 4-10.The accompanying graph shows the market for a good before and after an excise tax is imposed.The total tax revenue generated is indicated by
(Multiple Choice)
4.9/5  (40)
(40)
Figure 4-20
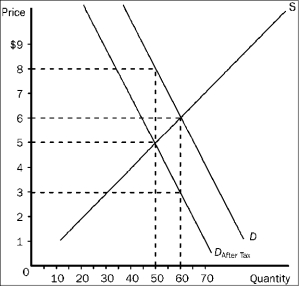 -Refer to Figure 4-20.The equilibrium price in the market before the tax is imposed is
(Multiple Choice)
4.9/5 (40)
If an increase in the government-imposed minimum wage pushes the price (wage)of unskilled labor above market equilibrium,which of the following will most likely occur in the unskilled labor market?
(Multiple Choice)
4.7/5 (37)
Suppose the federal excise tax rate on gasoline is increased by 50 percent.Which of the following is the most likely impact on the tax revenue derived from the federal gas tax?
(Multiple Choice)
4.8/5 (48)
When a government subsidy is granted to the buyers of a product,sellers can end up capturing some of the benefit because
(Multiple Choice)
4.9/5 (34)
Suppose the market equilibrium price of corn is $5 per bushel,and the government sets a price ceiling of $4 per bushel.What is the most likely result of this action?
(Multiple Choice)
4.8/5 (33)
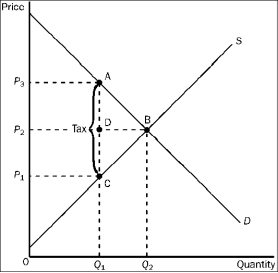
Figure 4-25
 -Refer to Figure 4-25.After the tax is levied,consumer surplus is represented by area
(Multiple Choice)
4.8/5 (43)
Use the figure below to answer the following question(s).
Figure 4-7
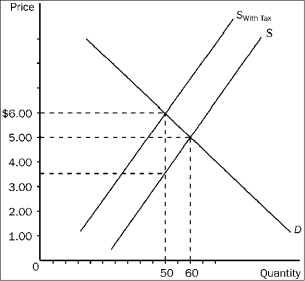
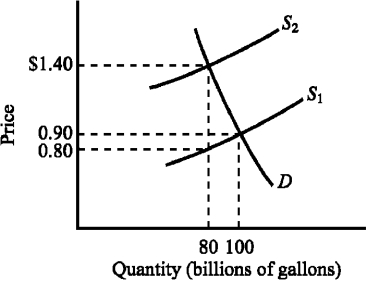 -Refer to Figure 4-7.The supply curve S₁ and the demand curve D indicate initial conditions in the market for gasoline.A $.60-per-gallon excise tax on gasoline is levied,which shifts the supply curve from S₁ to S₂.Imposing the tax causes the equilibrium price of gasoline to increase from
(Multiple Choice)
4.8/5 (42)
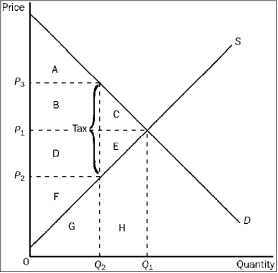
Figure 4-24
 -Refer to Figure 4-24.The amount of tax revenue received by the government is equal to the area
(Multiple Choice)
4.8/5 (37)
Other things constant,as the price of a resource increases,
(Multiple Choice)
4.8/5 (43)
When the purchase of a good is subsidized,economic analysis indicates that
(Multiple Choice)
4.9/5 (42)
When several hurricanes hit Florida in 2004,a number of local governments imposed price controls that prevented sellers from raising their prices for badly needed products like plywood and generators.In the areas where the controls were imposed,they resulted in
(Multiple Choice)
4.8/5 (35)
Suppose the equilibrium price of a physical examination ("physical")by a doctor is $200,and the government imposes a price ceiling of $150 per physical.As a result of the price ceiling,
(Multiple Choice)
4.8/5 (31)
When a tax is imposed on a good,the actual incidence of the tax generally
(Multiple Choice)
4.8/5 (38)
When a government subsidy is granted to the sellers of a product,buyers can end up capturing some of the benefit because
(Multiple Choice)
4.7/5 (39)
About 35,000 general aviation multiengine airplanes are licensed to operate in the United States.If an additional $1,000-per-year tax was levied on each plane to raise general revenue,economic thinking suggests the
(Multiple Choice)
4.8/5 (41)
Figure 4-22
 -Refer to Figure 4-22.The effective price sellers receive after the tax is imposed is
(Multiple Choice)
4.9/5 (34)
Filters
- Essay(0)
- Multiple Choice(0)
- Short Answer(0)
- True False(0)
- Matching(0)