Exam 2: Theories, Models and Data
Exam 1: Introduction to Key Ideas94 Questions
Exam 2: Theories, Models and Data91 Questions
Exam 3: The Classical Marketplace Demand and Supply111 Questions
Exam 4: Economic Activity and Performance106 Questions
Exam 5: Output, Business Cycles, Growth Employment87 Questions
Exam 6: Aggregate Expenditure Aggregate Demand112 Questions
Exam 7: The Government Sector131 Questions
Exam 8: Money, Banking Money Supply113 Questions
Exam 9: Financial Markets, Interest Rates, Foreign Exchange Rates & AD123 Questions
Exam 10: Central Banking and Monetary Policy125 Questions
Exam 11: A Traditional Ad As Model136 Questions
Exam 12: An AD As Model of the Inflation Rate and Real GDP182 Questions
Exam 13: Economic Growth118 Questions
Exam 14: International Macroeconomics113 Questions
Exam 15: International Trade108 Questions
Select questions type
The reason that economists often use a scatter diagram in their analysis is that:
(Multiple Choice)
4.7/5  (40)
(40)
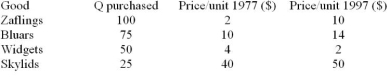 Table 2.1
-Table 2.1 shows the prices and quantities purchased of four different goods by the typical household in
1977 and 1997. Using 1977 as the base year, the value of the consumer price index in 1977 was:
Table 2.1
-Table 2.1 shows the prices and quantities purchased of four different goods by the typical household in
1977 and 1997. Using 1977 as the base year, the value of the consumer price index in 1977 was:
(Multiple Choice)
4.8/5 (33)
Consider a negatively sloped linear line in a graph where the vertical axis represents variable Y and the horizontal axis represents variable X. If the vertical intercept is 10 and the slope is -0.5, the correct equation is:
(Multiple Choice)
4.7/5 (35)
When economists make predictions using the framework of a given economic model, it is usually based on:
(Multiple Choice)
4.9/5 (39)
Product prices, consumer income, and the level of employment:
(Multiple Choice)
4.7/5 (37)
The primary reason why economists use models in their analysis is because a model:
(Multiple Choice)
4.9/5 (44)
Other things equal, suppose that the general level of prices decreases. You would be correct if you concluded that the real value of your income:
(Multiple Choice)
4.8/5 (36)
Suppose that the consumer price index has a value of 87 (1980 = 100) for 1987. This means that:
(Multiple Choice)
4.7/5 (40)
Which one of the following will not usually be included in an economic theory?
(Multiple Choice)
4.8/5 (37)
Suppose that in 2006, the CPI was 285, (1982 = 100). This index shows that the real value of a dollar in 2006:
(Multiple Choice)
4.9/5 (29)
Which one of the following statements does not characterize an economic model?
(Multiple Choice)
4.9/5 (30)
Filters
- Essay(0)
- Multiple Choice(0)
- Short Answer(0)
- True False(0)
- Matching(0)