Exam 2: Theories, Models and Data
Exam 1: Introduction to Key Ideas94 Questions
Exam 2: Theories, Models and Data91 Questions
Exam 3: The Classical Marketplace Demand and Supply111 Questions
Exam 4: Economic Activity and Performance106 Questions
Exam 5: Output, Business Cycles, Growth Employment87 Questions
Exam 6: Aggregate Expenditure Aggregate Demand112 Questions
Exam 7: The Government Sector131 Questions
Exam 8: Money, Banking Money Supply113 Questions
Exam 9: Financial Markets, Interest Rates, Foreign Exchange Rates & AD123 Questions
Exam 10: Central Banking and Monetary Policy125 Questions
Exam 11: A Traditional Ad As Model136 Questions
Exam 12: An AD As Model of the Inflation Rate and Real GDP182 Questions
Exam 13: Economic Growth118 Questions
Exam 14: International Macroeconomics113 Questions
Exam 15: International Trade108 Questions
Select questions type
A road map is like an economic model, because it provides us with:
(Multiple Choice)
4.8/5  (43)
(43)
If your nominal income has increased by 2 per cent in one year, while the inflation rate for the same year is 3 per cent, you can conclude that your real income:
(Multiple Choice)
4.9/5 (39)
Describe the different forms in which data are available to economic researchers.
(Essay)
4.8/5 (40)
Economic theories are worthless unless they are verified through scientific testing and hold true under all circumstances.
(True/False)
4.9/5 (35)
A rising average price level does not mean that all prices in the economy are rising.
(True/False)
4.8/5 (36)
CANSIM database, which is managed by Statistics Canada, is the most comprehensive source of data in Canada.
(True/False)
4.9/5 (31)
Why are economists frequently portrayed as being individuals who act only out of their own self-interest?
(Essay)
4.9/5 (36)
Consider a negatively sloped linear line in a graph where the vertical axis represents variable Y and the horizontal axis represents variable X. The slope of the horizontal linear curve is zero.
(True/False)
4.8/5 (36)
If the CPI for 2005 was 284.1, and economists predicted an inflation rate of 3.5 per cent for 2006, the predicted CPI at the end of 2006 was:
(Multiple Choice)
4.8/5 (41)
Assumptions are used in economic theories in order to simplify the theory.
(True/False)
4.8/5 (33)
Economic theories, like physics or chemistry, can be tested in a laboratory environment.
(True/False)
4.9/5 (35)
Evaluate the following criticism of economic models: 'Economic models always work with linear functions, and are therefore too simple to be useful or meaningful.'
(Essay)
4.9/5 (40)
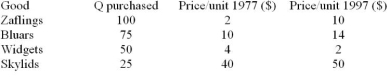 Table 2.1
-Using Table 2.1, in 1977 the greatest share of household income was spent on:
Table 2.1
-Using Table 2.1, in 1977 the greatest share of household income was spent on:
(Multiple Choice)
4.8/5 (38)
A basket of goods in 1987 cost $783, while the value of the same basket in 1997 was $1133. The value of this price index in 1997, based on 1987 = 100, was:
(Multiple Choice)
4.8/5 (40)
When economists use cross-section data, they collect and analyze information about the same economic variable at different points in time.
(True/False)
4.7/5 (26)
Filters
- Essay(0)
- Multiple Choice(0)
- Short Answer(0)
- True False(0)
- Matching(0)