Exam 13: Data Analytics
Sharon is the marketing manager for Smith Inc., and she has decided to launch a new campaign in the next couple of months. For this to be successful, Sharon will need to accumulate data and determine how to best target her demographic of young working professionals. Which of the following is an example of soft data that may be helpful as she plans her campaign?
D
Wally's Window Emporium is a leading producer and provider of residential windows across the United States. They just completed their second year of operations and compiled the following data: 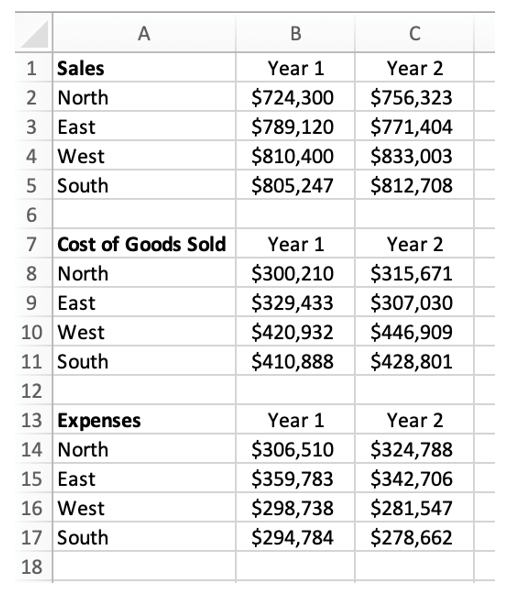 Management feels overwhelmed when they look at the data in this format, and they do not feel comfortable making decisions for the upcoming year until the data is easier to understand. The analytics team needs to present this information in a more user-friendly fashion so management can make data-informed decisions. With this information in mind, please answer the following questions.
a. What was the Gross Profit Percentage for each region for Year 2? What was the Net Income Percentage for each region for Year 2? (Round your answers to two decimal places.)
b. Which region had the largest percentage increase between years for Sales, Cost of Goods Sold (COGS), and Expenses? (Round your answers to two decimal places.)
c. What kind of graph would be most useful to display a comparison of net incomes for each region for Year 2? Create this graph.
Management feels overwhelmed when they look at the data in this format, and they do not feel comfortable making decisions for the upcoming year until the data is easier to understand. The analytics team needs to present this information in a more user-friendly fashion so management can make data-informed decisions. With this information in mind, please answer the following questions.
a. What was the Gross Profit Percentage for each region for Year 2? What was the Net Income Percentage for each region for Year 2? (Round your answers to two decimal places.)
b. Which region had the largest percentage increase between years for Sales, Cost of Goods Sold (COGS), and Expenses? (Round your answers to two decimal places.)
c. What kind of graph would be most useful to display a comparison of net incomes for each region for Year 2? Create this graph.
a. Gross Profit Percentage:
North = 58.26%
East = 60.20%
South = 46.35%
West = 47.24%
Net Income Percentage:
North = 15.32%
East = 15.77%
South = 12.55%
West = 12.95%
To calculate the Gross Profit Percentage, you need to create new cells with each region's name. In the cell to the right of the cell North, use the following formula: (Sales - COGS)/Sales, or = (C2-C8)/C2, which returns an answer of 58.26%. Repeat this for each region, and this results in: East = 60.20%, South = 46.35%, and West = 47.24%.To calculate the Net Income Percentage, you need to create new cells with each region's name. In the cell to the right of the name for North, use the following formula: (Sales - COGS - Expenses)/Sales, or = (C2-C8-C14)/C2, which returns an answer of 15.32%. Repeat this for each region, and this results in: East = 15.77%, South = 12.55%, and West = 12.95%.
b. Largest Percentage Increase: For Sales, North at 4.42%, for Cost of Goods Sold, West at 6.17%, and for Expenses, North at 5.96%.To calculate increases or decreases in sales, use the cell next to each region's name in Column D. Use the following formula: (Year 2 Sales - Year 1 Sales)/Year 1 Sales or, (C2-B2)/B2, which returns an answer of 4.42%. Repeat this for each region and this results in: East = -2.25%, South = 2.79%, and West = 0.93%. North had the largest percentage increase in Sales.To calculate increases or decreases in COGS, use the cell next to each region's name in Column D. Use the following formula: (Year 2 COGS - Year 1 COGS)/Year 1 COGS, or (C8-B8)/B8, which returns an answer of 5.15%. Repeat this for each region and this results in: East = -6.80%, South = 6.17%, and West = 4.36%. So, West has the largest percentage increase in COGS.To calculate increases or decreases in Expenses, use the cell next to each region's name in Column D. Use the following formula: (Year 2 Expenses - Year 1 Expenses)/Year 1 Expenses, or (C14-B14)/B14, which returns an answer of 5.96%. Repeat this for each region and this results in: East = -4.75%, South = -5.75%, and West = -5.47%. So, North has the largest percentage increase in Expenses.
c. The best graph to display a comparison of net incomes for each region in Year 2 would be a bar chart. Bar charts are useful when comparing total values between groups. To create a bar chart, enter the name of each region vertically. In the cell to the right of each name, you will need to calculate net income for that region for Year 2. Use the following formula: (Sales - COGS - Expenses). Repeat this for each region. Once you have finished, select the name of each region along with its Net Income. Select Insert, then Chart, and then Bar. The resulting chart should look like this: 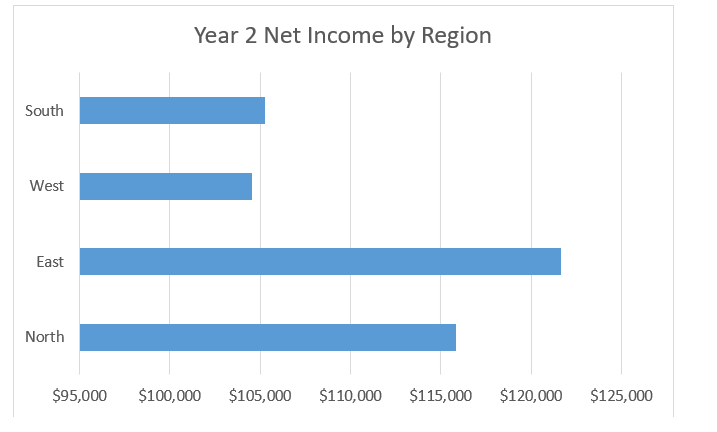
Sampson Inc. is a producer of plastic products including bottles and sandwich bags. Management decided they need to be pre-informed about the financial performance of the organization and will utilize data analytics. As part of their predictive analytics, they are going to use association rules. Which of the following is a potential outcome of using this method?
B
Trevor is about to enter his third year of a pre-med program and knows the program will continue to become more competitive. He needs to ensure that his GPA will be on par with that of his classmates. He has earned the following GPAs in his courses to date: 4, 3, 3, 2, 2, 4, 4, 4, 4, 3, 3, 3, 3, 4, 2, 2, 3, 4, 4, and 3. The average GPA for pre-med students is 3.75. Using Excel, determine how close Trevor's GPA is to that average. (Round intermediate calculations to two decimal places.)
Houz Inc. is a regional furniture manufacturer who specializes in new midcentury replicas at affordable prices. The management and decision makers at Houz gathered data from past years and are performing some analysis. If the company wants to address the change in raw materials costs over the past five years, then what type of data analysis would be most appropriate for that, and why?
Companies that collect data from their users must do so with great care and consideration before proceeding. Failure to exercise due care can have very strong consequences for companies who neglect this responsibility. Which of the following is an example of a consideration made to protect the privacy of collected user data?
Data analytics has become a very high-demand skill for employees regardless of their industry. The goal of decision makers gravitates towards the increase of data accessibility and usability with an overall goal of making more data-informed decisions. Within the cost accounting sphere, outcomes achieved are divided into four areas. Which of the following is an accurate description of one of these four areas?
As companies integrate data analytics and shift their focus towards the future, they need to utilize predictive analytics. This kind of analytics uses both historical data and statistical models to predict future outcomes. If a company is interested in looking more closely at its shipping department, then which of the following is a challenge this company might face using predictive analytics?
Sarah works for a mid-size law firm as a staff accountant. Sarah wants to develop her skills into something more valuable to her organization and more marketable in general. She knows data analytics is an incredibly popular new area for high-demand skills. What are some ways that Sarah can add some data analytics perspective to support her goals?
As companies continue to embrace the evolution of data collection and data analytics, they also need to determine what data to collect. After establishing what data to collect, they may want to determine the best way to collect the needed information. Which of the following best represents information a lawn care business would need to collect for data analytics?
The field of data analytics has become an increasingly in-demand skill across business world since its inception. As employers focus on what they are looking for in potential employees, data analytics has become a desirable skill for accountants. Which of the following is an example of why accountants are well-suited for data analytics?
Joseph is a business student at a local university. He is looking over his transcripts to determine how his performance looks so far. He pulled the following report from his profile on the University's Student Information section: 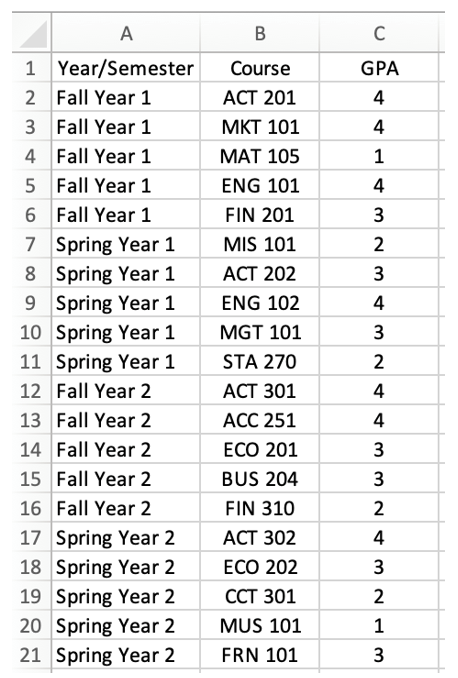 At this University, A = 4, B = 3, C = 2, D = 1, and F = 0. How many of each of the possible letter grades did Joseph receive?
Sophia owns a salon that provides an array of services for her customers. She has been collecting data for the past 2 years. The sales revenues from her five most-common services are as follows: 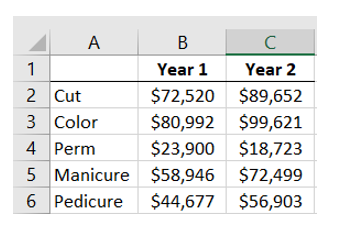 Which service had the largest magnitude of change in sales revenue from Year 1 to year 2 (up or down)?
Sharon is the marketing manager for Smith Inc., and she has decided to launch a new campaign in the next couple of months. For this to be successful, Sharon will need to accumulate data and determine how to best target her demographic of young working professionals. Which of the following is an example of hard data that may be helpful as she plans her campaign?
Courtney is preparing to graduate in a few months with a degree in accounting. She has been working diligently on mastering the material she is learning in her classes as well learning about what potential employers seek in a job candidate. In addition to accounting and business knowledge, which of the following could be a potential skill sought after by an employer?
Benson Company is a retailer that specializes in the e-commerce sale of small office supplies including decorative file folders, personalized desk calendars, and trendy desk accessories. As part of their annual review, management decided to perform some analysis on trends over the past five years. One manager suggested they use data visualization for this purpose. If management would like to analyze how well the company achieved their sales targets over the past five years, then what type of chart would be the best to use to do this?
As practitioners increase their knowledge in data analytics, some companies have moved towards collecting information in new and different ways. Additionally, decision makers have taken their newly collected data and devised ways that it can benefit the organization the most. Which of the following is an example of a way that organizations use data analytics in cost accounting decisions?
Fancy Footwear is a premier designer and manufacturer of designer shoes for women. Over the past two years, they have concerted a lot of effort into both their boots and heels divisions. The results of their efforts are shown here: 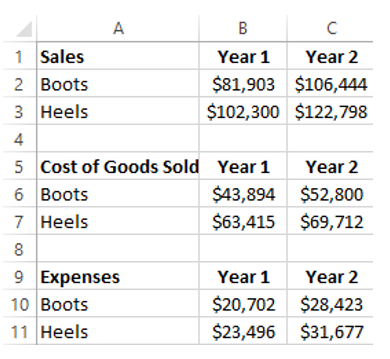 Management is interested in analyzing this data. What is the percent change in gross profit for both the Boots and Heels divisions from Year 1 to year 2? (Use parentheses around a number to indicate a negative value or loss.)
As more users engage in online activity, more data circulates and more information is collected by outside entities. In the United States, there are laws that govern the collection of information rather than a single comprehensive policy or agency. Which of the following is an example of a law that oversees the collection and use of credit information?
Decision makers have to establish their needs and discover what data will help them to answer their queries. This data can be attained from a variety of sources, but these sources can be divided into the categories of internal or external. Which of the following best represents an example of a source of external data?
Filters
- Essay(0)
- Multiple Choice(0)
- Short Answer(0)
- True False(0)
- Matching(0)