Exam 20: Chi-Square and Inference About Frequencies
Exam 1: Introduction25 Questions
Exam 2: Frequency Distributions, Percentiles,34 Questions
Exam 3: Graphic Representation of Frequency Distributions25 Questions
Exam 4: Central Tendency25 Questions
Exam 5: Variability and Standard Z Scores37 Questions
Exam 6: Standard Scores and the Normal Curve27 Questions
Exam 7: Correlation38 Questions
Exam 8: Prediction40 Questions
Exam 9: Interpretive Aspects of Correlation and Regression23 Questions
Exam 10: Probability29 Questions
Exam 11: Random Sampling and Sampling Distributions24 Questions
Exam 12: Introduction to Statistical Inference: Testing Hypotheses About Single Means Z and T74 Questions
Exam 13: Interpreting the Results of Hypothesis Testing: Effect Size, Type I and Type II Errors, and Power42 Questions
Exam 14: Testing Hypotheses About the Difference Between Two Independent Groups33 Questions
Exam 15: Testing for a Difference18 Questions
Exam 16: Inference About Correlation Coefficients24 Questions
Exam 17: An Alternative to Hypothesis Testing: Confidence Intervals28 Questions
Exam 18: Testing for Differences Among Three or More Groups: One-Way Analysis of Variance and Some Alternatives49 Questions
Exam 19: Factorial Analysis of Variance30 Questions
Exam 20: Chi-Square and Inference About Frequencies27 Questions
Exam 21: Some Almost Assumption-Free Tests19 Questions
Select questions type
Only red and blue flowers are produced from a particular seed mixture. We plant a random sample of 27 seeds and obtain 6 blue and 21 red flowers. We wish to test the null hypothesis that the mixture gives twice as many red flowers as blue flowers. The value of fe for red flowers is
(Multiple Choice)
4.9/5  (37)
(37)
In a contingency table, the number of degrees of freedom is
(Multiple Choice)
4.8/5 (38)
Use the following data to answer Questions
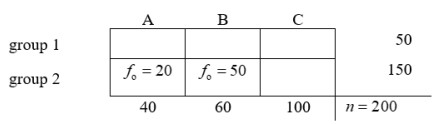 -The number of degrees of freedom for this problem is
(Multiple Choice)
4.7/5 (29)
In a poll taken 3 months ago, the preferences of voters among three candidates running for mayor were: Smith = 45%, Jones = 35%, and Thompson = 20%. Candidate Thompson's election committee has just polled 120 likely voters at random and found that 40 said that they would vote for Smith, 35 for Jones and 45 for Thompson. Has the voter's preference changed since the earlier poll [use ( = .05)]?
(Short Answer)
4.9/5 (42)
The chi-square distribution is like the t distribution in that
(Multiple Choice)
4.9/5 (43)
We want to know whether the proportion of freshman men who select psychology as their major differs from the proportion of freshman women who do so. This question may be tested by
(Multiple Choice)
4.8/5 (37)
In chi-square analysis of the contingency table, the null hypothesis is that
(Multiple Choice)
5.0/5 (33)
Filters
- Essay(0)
- Multiple Choice(0)
- Short Answer(0)
- True False(0)
- Matching(0)