Exam 8: Prediction
Exam 1: Introduction25 Questions
Exam 2: Frequency Distributions, Percentiles,34 Questions
Exam 3: Graphic Representation of Frequency Distributions25 Questions
Exam 4: Central Tendency25 Questions
Exam 5: Variability and Standard Z Scores37 Questions
Exam 6: Standard Scores and the Normal Curve27 Questions
Exam 7: Correlation38 Questions
Exam 8: Prediction40 Questions
Exam 9: Interpretive Aspects of Correlation and Regression23 Questions
Exam 10: Probability29 Questions
Exam 11: Random Sampling and Sampling Distributions24 Questions
Exam 12: Introduction to Statistical Inference: Testing Hypotheses About Single Means Z and T74 Questions
Exam 13: Interpreting the Results of Hypothesis Testing: Effect Size, Type I and Type II Errors, and Power42 Questions
Exam 14: Testing Hypotheses About the Difference Between Two Independent Groups33 Questions
Exam 15: Testing for a Difference18 Questions
Exam 16: Inference About Correlation Coefficients24 Questions
Exam 17: An Alternative to Hypothesis Testing: Confidence Intervals28 Questions
Exam 18: Testing for Differences Among Three or More Groups: One-Way Analysis of Variance and Some Alternatives49 Questions
Exam 19: Factorial Analysis of Variance30 Questions
Exam 20: Chi-Square and Inference About Frequencies27 Questions
Exam 21: Some Almost Assumption-Free Tests19 Questions
Select questions type
When the correlation is perfect, every value of ____________ is zero.
Free
(Multiple Choice)
4.9/5  (41)
(41)
Correct Answer: Verified
A
 and
and  ;
;  and
and  If
If  and X is 40, what value do we predict for Y?
Free
(Multiple Choice)
4.8/5 (46)
Correct Answer:Verified
B
 and
and  ;
;  and
and  If
If  and X is 40, what value do we predict for Y?
Free
(Multiple Choice)
4.8/5 (38)
Correct Answer:Verified
A
For the group of adult joggers competing in the Windy City Mini-marathon, the following are the summary statistics for annual income (X) and time to complete the race (Y):
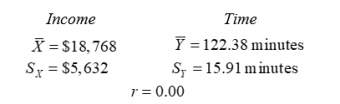 (a) Jack L. and Linda P. have annual incomes of $12,372 and $24,812, respectively. What race times would you predict? (Hint: No calculations are necessary). (b) What general principle is illustrated by this problem?
(Short Answer)
4.8/5 (36)
In predicting Y from X, the regression line is laid down so that the squared discrepancies between points and the line are minimized
(Multiple Choice)
4.9/5 (39)
John Jones falls one standard deviation above the mean of X.
(a)If his predicted score on Y falls one standard deviation above  what is the correlation between X and Y?
(b)If his predicted score on Y falls one-third of a standard deviation above
what is the correlation between X and Y?
(b)If his predicted score on Y falls one-third of a standard deviation above  what is the correlation between X and Y?
(Short Answer)
4.8/5 (35)
The following are the scores on a job selection test administered prior to hiring (X) and supervisor's ratings after 3 months on the job (Y) for a group of bank tellers (A-F):
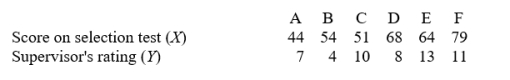 (a) Compute from these data the summary statistics required for developing the raw-score regression equation for predicting supervisor's rating from job selection score.
(b) Use the values from (a) to arrive at the regression equation in simplest form.
(c) Three new applicants for teller positions obtain scores of 48, 62, and 72, respectively, on the selection test. Compute their predicted supervisor's ratings.
(d) If in fact the above data were real, what objection would you have to using the equation from (b) to predict in a "real-life" situation?
(a) Compute from these data the summary statistics required for developing the raw-score regression equation for predicting supervisor's rating from job selection score.
(b) Use the values from (a) to arrive at the regression equation in simplest form.
(c) Three new applicants for teller positions obtain scores of 48, 62, and 72, respectively, on the selection test. Compute their predicted supervisor's ratings.
(d) If in fact the above data were real, what objection would you have to using the equation from (b) to predict in a "real-life" situation?
(Short Answer)
4.9/5 (32)
In concept, the regression line is most closely related to the
(Multiple Choice)
4.8/5 (31)
Which value of r permits the greatest accuracy of prediction?
(Multiple Choice)
4.8/5 (40)
From the records of a large health maintenance organization, an investigator is able to gather a sizeable sample of men for whom heights at both age 10 and as adults are known. The following are the summary statistics for this sample:
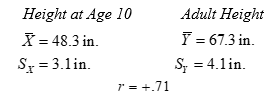 (a) Use the above values to arrive at the raw-score regression equation for predicting height as an adult from height at age 10. Present the equation in simplest form.
(b) Use the regression equation from (a) to predict adult height for the following 10-year-olds: Benny (42.5 in.), Cal (55.3 in.), Arthur (50.1 in.).
(c) Consider Benny's predictable adult height. In what sense is that value a mean? Be very specific.
(a) Use the above values to arrive at the raw-score regression equation for predicting height as an adult from height at age 10. Present the equation in simplest form.
(b) Use the regression equation from (a) to predict adult height for the following 10-year-olds: Benny (42.5 in.), Cal (55.3 in.), Arthur (50.1 in.).
(c) Consider Benny's predictable adult height. In what sense is that value a mean? Be very specific.
(Short Answer)
4.9/5 (30)
For a large group of subjects: 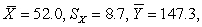 and
and  Captain Crunch obtains an X score of 52. What is his predicted Y score if (no calculations necessary):
(a)
Captain Crunch obtains an X score of 52. What is his predicted Y score if (no calculations necessary):
(a)  (b)
(b)  (c)
(c)  (d)
(d)  (e)State the principal illustrated by your answers to (a) through (d).
(Short Answer)
4.8/5 (38)
What value of r leads us to predict that  no matter what the value of X?
(Multiple Choice)
4.9/5 (41)
Accuracy of prediction by the regression equation is enhanced by
(Multiple Choice)
4.9/5 (29)
A standard score regression equation reads:  If the correlation coefficient is +.5 and Johnny is two standard deviations above the mean in X, what standard score position shall we predict for him in Y?
(Multiple Choice)
4.8/5 (38)
Filters
- Essay(0)
- Multiple Choice(0)
- Short Answer(0)
- True False(0)
- Matching(0)